The project aimed to create control board for half-bridge topology with the possibility of setting the frequency using a computer program. Additionally, control board has synchronous sampling of the current waveform for accurate phase and amplitude measurements and plotting the graph of these parameters on a PC. This type of circuit is useful for measuring SMPS transformers (in this case used in half-bridge or full-bridge topology) in an open loop. We can thus determine the maximum gain of our transformer and with the appropriate modification of the software plot a Bode chart. At the same time, the project is a development of the previous software on which I made, among others, such "toys":
Of course, these are not the only possibilities of such a system, it is even possible to generate a sine at the output using SPWM (https://www.sciencedirect.com/topics/engineering/full-bridge-inverter fig 1.18), to power tesla coils or other devices where AC voltage waveform is required.
Having a ready platform, you can focus on creating your own software or using ready-made software to examine your work, so you can limit the space where you can make a mistake and thus developing your ideas will be much easier. If anyone is curious whether his idea would be possible to implement on this type of device then feel free to ask a question.
How to download and run the code.
The code can be downloaded from the github repositories:
https://github.com/marcinszajner/Half-bridge-driver-MCU
https://github.com/marcinszajner/Half-bridge-driver-python
1. Install cygwin with make
2. Add cygwin bin folder to environment variables
2. download gnu toolchain
https://developer.arm.com/tools-and-software/...software/developer-tools/gnu-toolchain/gnu-rm
3. Add gnu toolchain to environment variables
4. Install openOCD
5. Add openOCD bin to environment variables
6. Install the st-link drivers
7. Clone the Half-bridge-driver-MCU repository
8. Call make in the project folder
9. To make uC flash, make make flash.
1. Install python 3.8
2. Install pyCharm and configure it for python 3.8
3. Install Qt designer
4. Clone the Half-bridge-driver-python repository, download the project to pyCharm
5. Install requirements.txt (python -m pip install -r requirements.txt) or do it via pyCharm
6. Run main in pycharm
To edit the graphic interface I recommend using Qt designer. All you have to do is open the gui.main.ui file, edit it and then use the toPyCode.sh script to convert it to a .py file
And how does it work in practice? Here is a recording presenting the operation of the control board (with RLC load):
Hardware
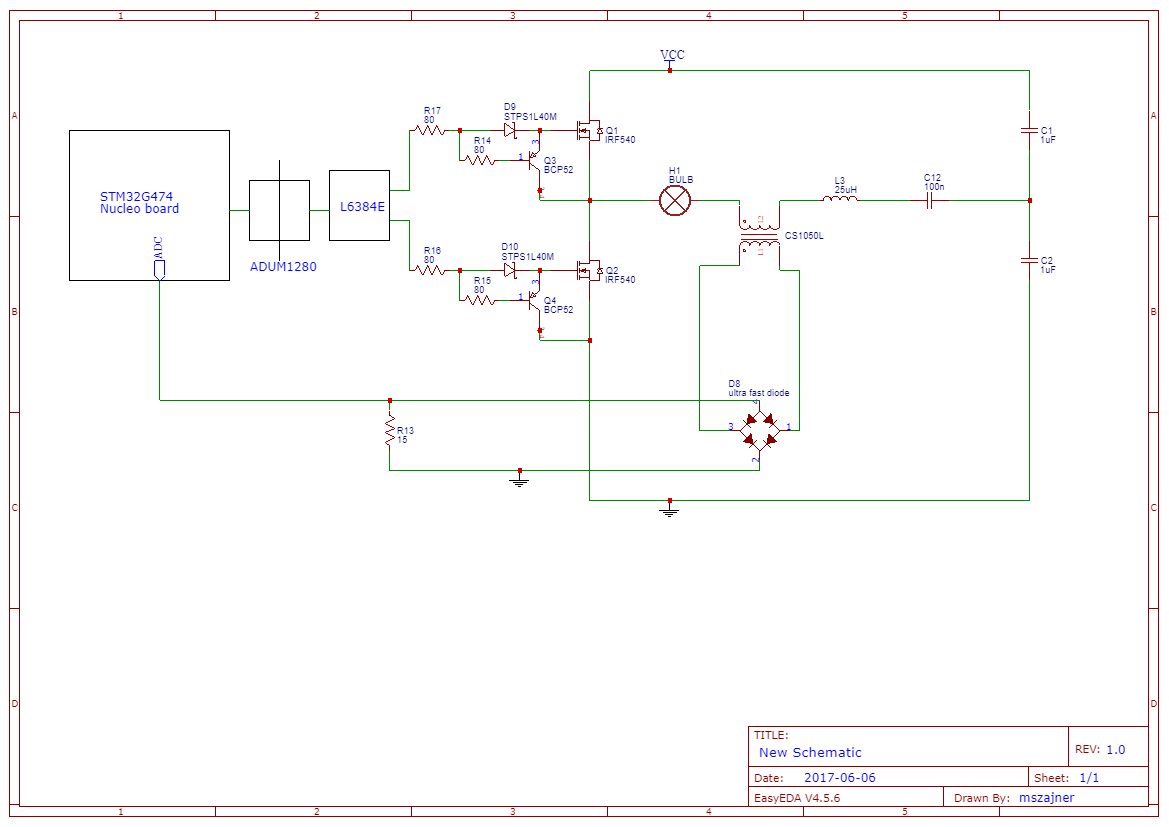
Unfortunately, some time ego I lost schematics to this prototype version, but I attach the schematic diagram and a description of the elements used.
I use a current transformer (CS1050L) to measure the current. The signal from the transformer passes through the rectifier bridge and then to a 15Ohm measuring resistor. Using the fact that the current transformer output is a current source, the diodes in the rectifier bridge do not introduce too much error in the measurement. I measure the voltage across the measuring resistor via ADC with uC. Although I don't have any low-pass filter at the input to the ADC, the first harmonic resonance measurement results are very good and comparable to the I-prober 520. However, the signal on the resistor is strongly distorted which requires improvement in the newer PCB version.
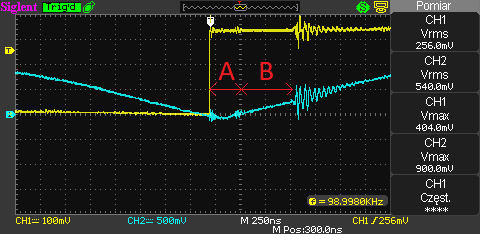
I'm using l6384 as the half-bridge driver. However, this is not the best driver for frequencies above 100kHz. 500ns dead time is definitely noticeable.
A - delay caused by signal propagation in the circuit. B - Dead time driver.
The delay associated with the propagation of the control signal does not cause any problem, however, a dead time of 500ns which is 1/20 of the whole signal seriously affects the entire system.
In new version of PCB I planing use driver similar to tlp250 and set dead time on control board.
400 mA source and 650 mA sink current are not very suitable for mosfets with a large gate load. When the half bridge is powered from 30V it does not matter, but at 325V it will be of great importance and cause large losses on commutation of keys.
MCU
For power electronics purposes, only two relatively affordable families are available on the market - C2000 from TI and a series of dedicated SoCs from ST with cortex-m4. I decided on the ST company and their NUCLEO64 board with the stm32g474 chip. It is the successor of the stm32f334 system. The main feature of this system is HRTIM, which in the case of actual software operates at a equivalent frequency of... 2.72GHz which provides a resolution of 368ps. This gives the possibility of very precise control of the output frequency of the half bridge.
Side extras that we find on this SoC include:
- Adaptive real-time accelerator
- FPU, DSP instructions
- CORDIC for trigonometric functions acceleration
- FMAC: filter mathematical accelerator
- CCM SRAM
- amplifiers, ADC, DAC, comparators
GUI PC
To make some of the software on the PC side I used the PYTHON script language with the PyQt library. Why? I wanted to gain some experience in this language and its use in this type of projects. The use of Qt designer makes GUI creation and modification quite easy, and the python itself surprisingly proved itself as a language for this type of application, although there were surprises like strange behavior of threads or methods not working as described, but fortunately sporadically.
Overall, I'm satisfied to use Qt with python.
Program at uC
In general, not much is happening here. In the main function we initialize GPIO, ADC, crc, hrtim, USART from DMA. Then start hrtim and switch to blinking LED to check that the microcontroller is not too expropriated by interrupts.
Communication with a PC consists of receiving a message with a request, properly processing it and sending a reply if necessary. The code on the PC side ensures that only one message is sent that requires a response. There are currently only two types of messages:
protocol_change - A message that does not require a response to change the state of the system (currently the frequency)
protocol_data_req - A message requesting data. The answer is protocol_data_resp
Sampling is done by interrupting ADC in inject mode. ADC is triggered by compare unit hrtimera, which ensures sampling at the right point in the timeline (in the right phase). Unfortunately, this solution is bad because it allows me to achieve about 2.5MHz sampling frequency, which is a bit too low and will require rewriting the functionality of collecting samples.
USART from DMA works almost maintenance-free, all you have to do is enter the pointer to the beginning of the buffer and the number of bytes to send, so it doesn't consume too much core resources.
Theory of signal processing
Fast fourier transformate is an algorithm for discrete fourier transfoemate, which is a transform for a discrete (not continuous) space, and the fourier transform is contained in the Laplace transform.
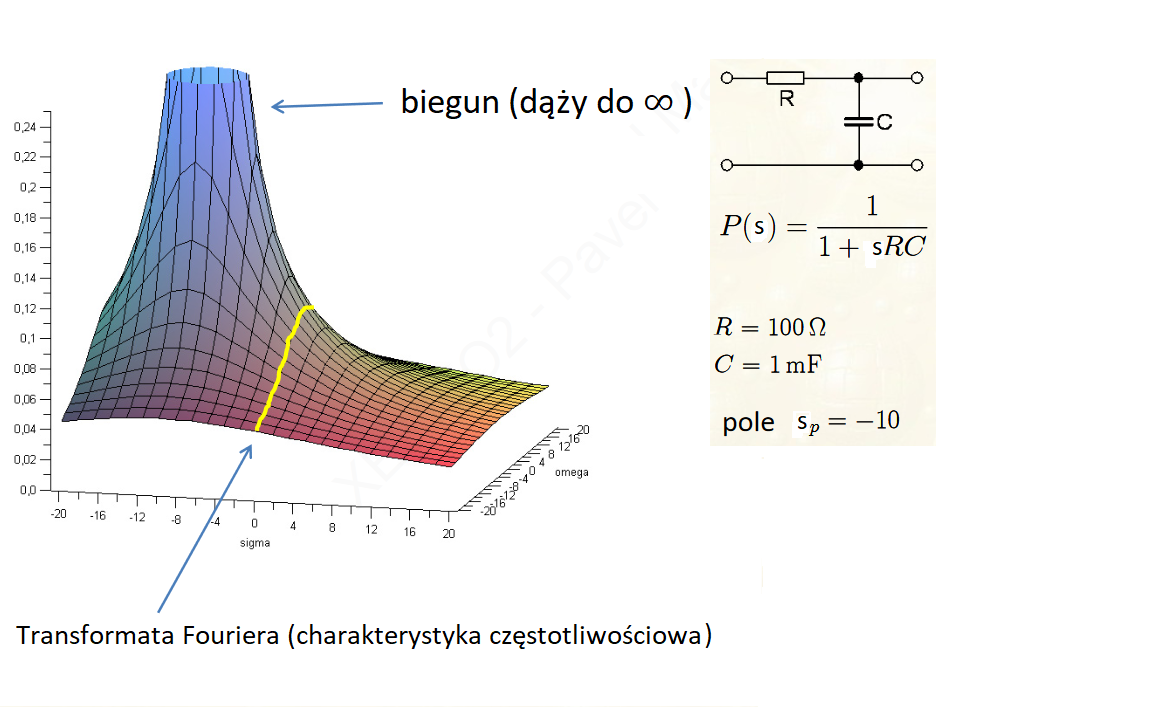
This is best illustrated by the graphic representation.
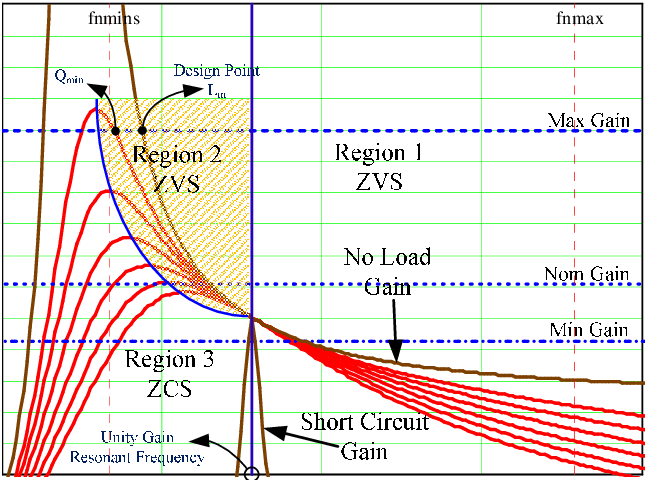
This is a special case of the Laplace transform. The number s can be represented as the pair σ + jω, and the fourier transform is the case when σ (sigma) is equal to zero. What is sigma at all? It is attenuation constant or dumping factor. We can see it nice on LLC converter characteristic, when we draw fourier plot for few loads:
So, using the Fourier transform, we actually operate on a segment of the Laplace transform for sigma = 0. Unfortunately, in this case we lose information resulting from transient states, as for example the signal decay time for the low-pass RC filter.
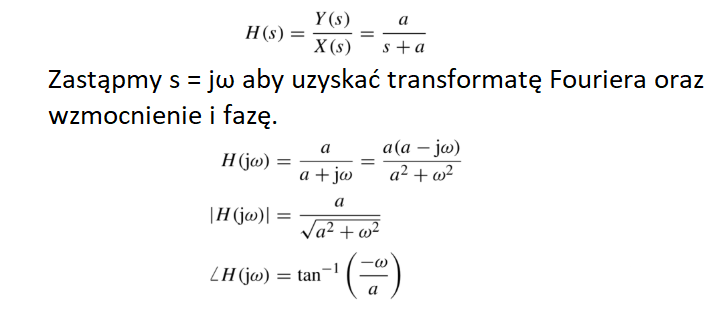
However, if we are not interested in transient states and want to focus on periodic waveforms, we can replace s with jω value or perform Fourier transform at once.
Take for example the transfer function:
With digital technology, however, we do not analyze a continuous signal (neither in time nor in values), but individual points in space - a discrete signal.
In this case, I don't want to delve into the Z and DFT transform anymore, just go to the level of FFT abstraction (the numpy module uses the Cooley-Tukey algorithm).
Below I present very basic information that is useful, but it is worth being aware that this is not all that fft and DSP offer.
We make FFT on an N elemental sample vector (window). The algorithm itself knows nothing about frequency, this information is provided by the user when analyzing the obtained complex vector. Exactly so, the result in the Laplace transform is the complex vector of numbers. These numbers carry for us all relevant information - the length of the vector and the slope of the vector to the positive axis of real numbers for the corresponding frequency. I think for most the concept of magnitude is not foreign and is quite well understood, but with the phase it is a bit worse.
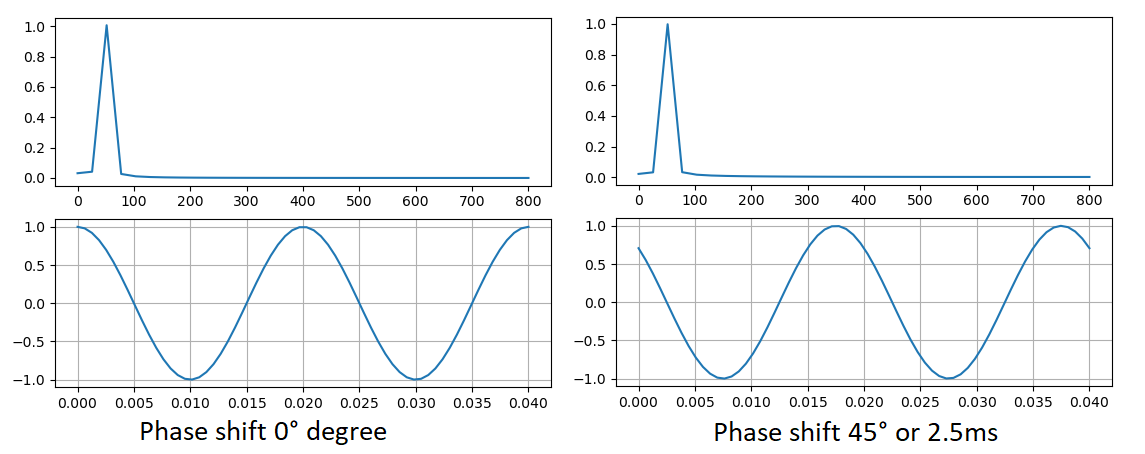
What is the phase? The phase is nothing but... time, and more precisely the time of delay between one signal and another. How is it between two signals? After all, in the vector we only have the signal we sample. Here we have to mention the sample window. To get the best accuracy for the fft algorithm, integer number of periods of signal should be in the sampling window and it should be an even function to get zero phase shift. If we examine the course of cos (50 * 2 * pi * t), we will get a beautiful amplitude and zero phase shift. However, when we try to draw something (50 * 2 * pi * (t + 0.0025)) or something (50 * 2 * pi * t + 0.785375) it gives us a phase shift of 45 degrees.
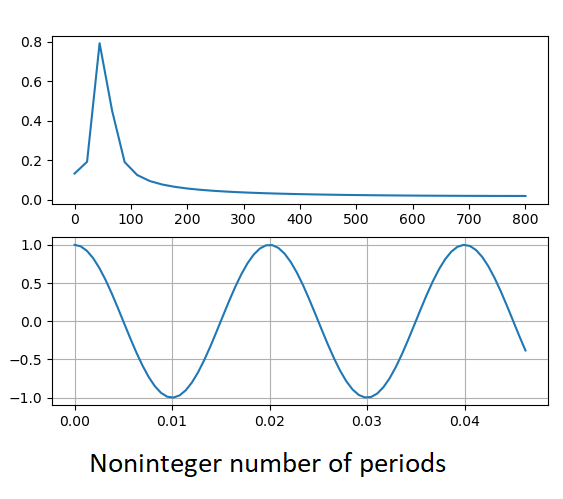
However, what if the samples do not contain the integer number of periods of the tested signal. Unfortunately, then the quality of the result decreases significantly and a spectrum leak occurs:
To counteract this, we can impose window functions that allow you to reduce the problems arising from the incomplete multiplicity of the signal being tested and thus the spectrum leakage.
For the above reason, the assumption of my software was synchronous sampling in order to obtain the integer number of periods of the tested signal. Thanks to this procedure, we can get a very accurate signal phase and amplitude using a very small number of samples. In addition, the signal does not require additional processing in the form of overlapping window functions or interpolation, so the digital processing of such a signal is very fast, either on uC or on the PC. The current program, unfortunately, does not allow obtaining too high sampling frequency (8 samples per period), which does not allow to get a view for the higher harmonics of the tested signal, however I will try to improve the program to get 16 or even 64 samples per period (for a certain frequency range).
I take the signal from a current transformer with a rectifier bridge, which introduces two significant distortions:
1. The signal is no longer a sine / cosine
2. Deletes the constant component
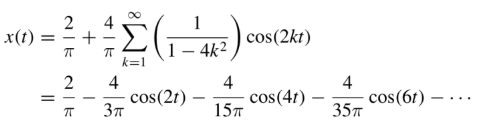
Sine restoration is very simple, based on fourier sequence for the upright signal:
Adding further harmonics and a constant component, we reproduce the sine/cosine waveform with phase shift and double frequency. However, these distortions are constant and we can remove them in the process of subsequent analysis of the fft result.
The bigger problem starts when the tested system has a constant component. If we have an AC signal containing an additional DC component, I suspect that we can analytically reproduce it, but when the DC component is dominant (the signal is DC), I do not see the possibility of reproducing it. That's why I'm thinking about adding a measuring resistor to measure the DC component of the signal and add it to the obtained signal from fft.
sources
(1)
https://books.google.pl/books?id=866PDwAAQBAJ...&q=plot%20laplace%20transform%20phase&f=false
(2)
https://books.google.pl/books?id=wnpTDwAAQBAJ...QAQ#v=onepage&q=plot%20laplace%20transform&f= false
(3)
https://download.ni.com/evaluation/pxi/Understanding%20FFTs%20and%20Windowing.pdf
(4)
https://books.google.pl/books?id=GV5mDwAAQBAJ...HcfrA6UQ6AEwCnoECAkQAQ#v=onepage&q=rectified% 20sine% 20reconstruct% 20to% 20sine & f = false
As I will soon be modernizing the whole control board, including wireless communication with a PC, more inputs (4 + 1 transformer), improved the quality of measuring paths and a half bridge control system, I have a question for you, what would you like to see in such a system? Maybe the system will be useful to a larger number of users due to additional functionalities?


Comments
Very interesting tests, but I do not understand everything. "I use a current transformer (CS1050L) to measure the current. The signal from the transformer passes through a rectifier bridge and then... [Read more]
I will answer the questions here, but it will take me a while, so I will modify this post by answering the next questions. Question 1 Yes, the current flowing in the transformer is proportional to... [Read more]
HRTIM does not work with such a high frequency, but with such an "equivalent frequency", there is a Delay-Locked Loop (DLL). [Read more]
I have prepared idea schematic for new half bridge control board: https://obrazki.elektroda.pl/2393265500_1594557008_bigthumb.jpg I planned these features for this revision - Synchronized... [Read more]
The design is so thoughtful that it is still difficult to add something, but I thought about additional configurable trigger outputs for the oscilloscope, e.g. you can trigger the oscilloscope before opening... [Read more]
Usually, I used the bridge control signal (pin on uC) to trigger the oscilloscope. Even when I used burst mode, there was no trigger problem: With digital oscilloscopes, there is also no problem... [Read more]