Wemos D1 "Arduino" and DHT11 - a simple weather station with graphs on the website
My previous topic about creating charts on Arduino R4 received a greater response than I expected, so now, for a change, I am making a similar project but in a more complete form and on the ESP8266 platform in PlatformIO. Typically, the whole thing will be assembled from ready-made libraries, and I will describe the process in the form of a tutorial. First, I will run the DHT11 temperature and humidity sensor here, then I will show you how you can download the current time from the Internet. Then I will demonstrate how to collect measurements in memory in a circular buffer, and finally display them on a simple web page with a graph, all available within our WiFi.
First steps
Some time ago I published a topic about ArduinoOTA and ESP8266 in PlatformIO , I recommend you read it. Here I am assuming that we have OTA running and I will use what I developed earlier. As a reminder - here is my "hello world":
Code: C / C++
In this topic, we try to assemble everything from ready-made elements, so we will also use a ready-made library for the DHT11 sensor. We just need to install it.
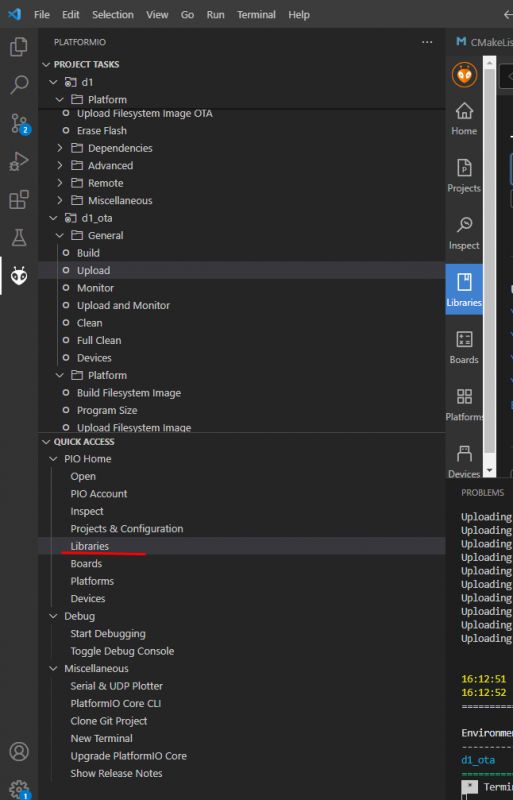
Open the Libraries tab:
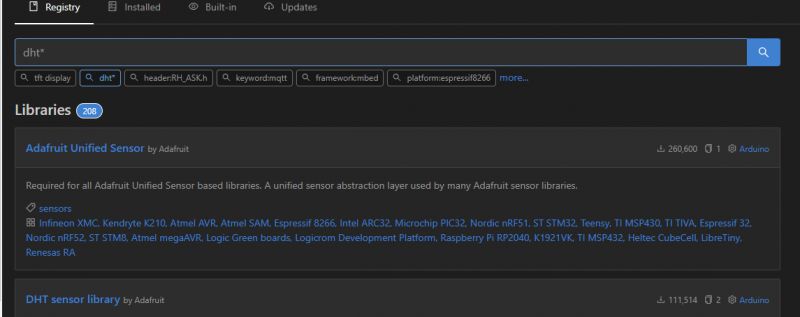
We look for DHT. The DHT library also requires the Adafruit Unified Sensor Library to be added, so we add both libraries. First Unified Sensor:
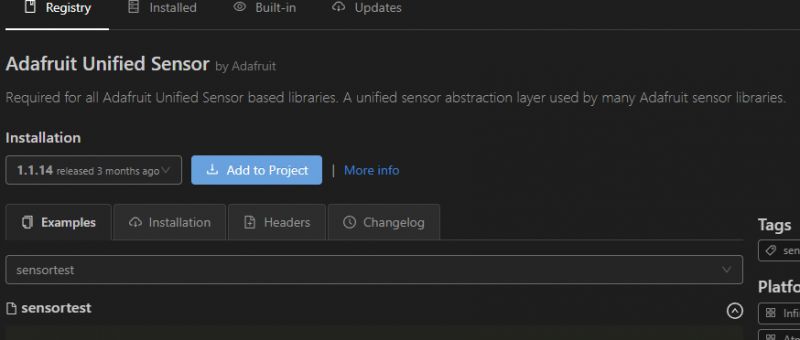
We add to the project:
We will need to indicate to which project we are adding this library:
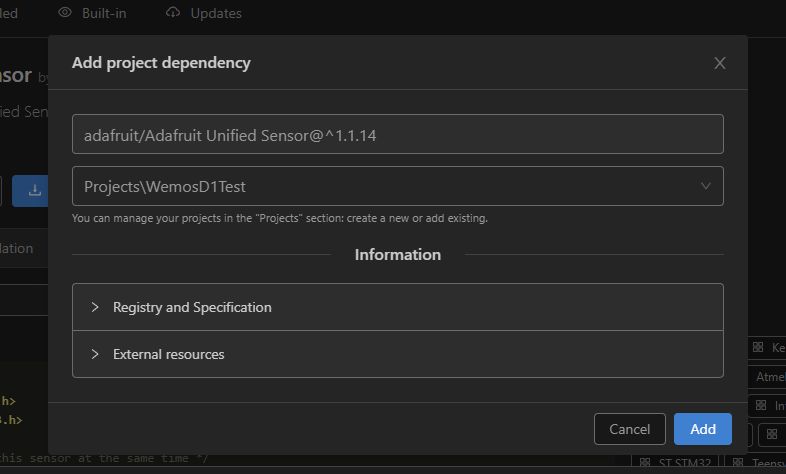
Added:
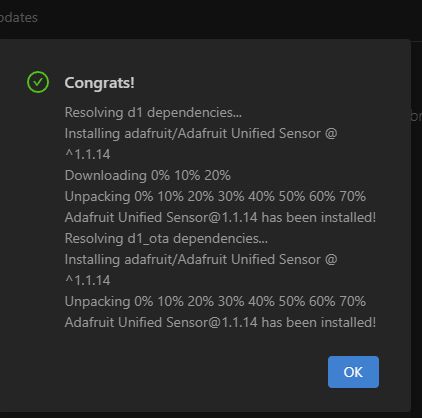
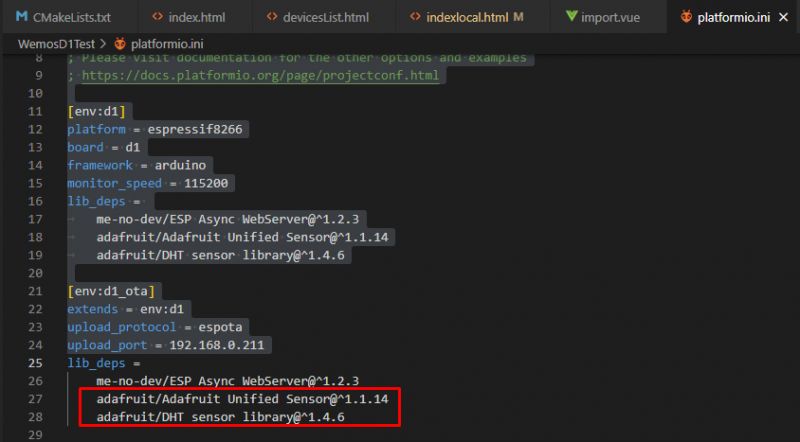
This is how we add both libraries. A keen eye will notice that they have also been added to our platformio.ini:
It is also worth noting that there is also an example of its use on the library`s website:

Let`s integrate it into our code. I perform the measurement when the diode status is switched:
Code: C / C++
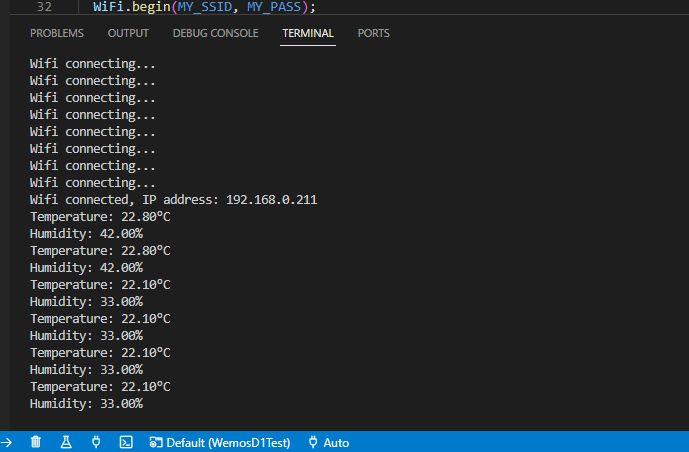
At the moment, I only send results via UART. Then we will make a website. Let`s first check if DHT works at all:
We add a website
Putting our measurements out into the world is really very simple. A class is used to create a server ESP8266WebServer . First, we include its header:
Code: C / C++
Then we create its instance, the argument is the port on which the server will be created (HTTP is usually port 80):
Code: C / C++
Then we create functions that handle the page data:
Code: C / C++
In the main loop we serve clients:
Code: C / C++
And finally, the function that handles the main page:
Code: C / C++
Result:
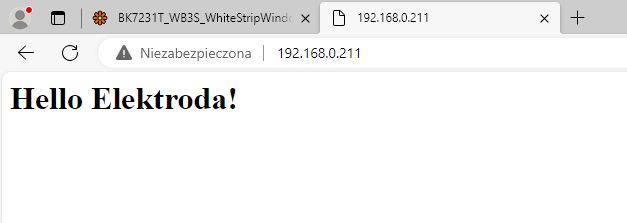
It`s really very simple. Now we will display the temperature.
We display the temperature
To display the temperature on the page we need to do two things:
- these measurements need to be saved, for simplicity we will put them in global variables
- they must then be placed in the text of the page, I will use my favorite method to format the string, i.e. a C-style buffer and the sprintf function.
Global variables themselves:
Code: C / C++
Writing to global variables:
Code: C / C++
Modified page creation function:
Code: C / C++
In this way, the temperature and humidity read from DHT will appear on our screen.
Network time (NTP)
NTP stands for Network Time Protocol, a way to obtain time from the network. We also have a ready-made one here, we will use the class NTPClient . We add the appropriate library as before:
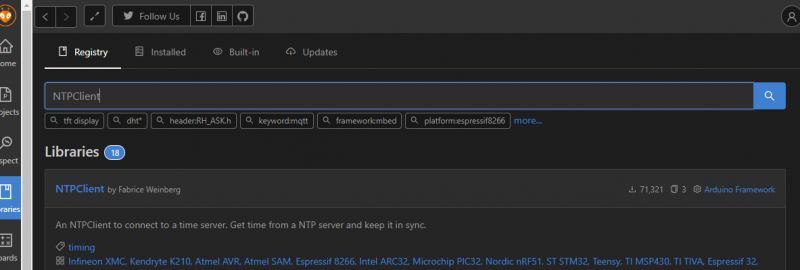
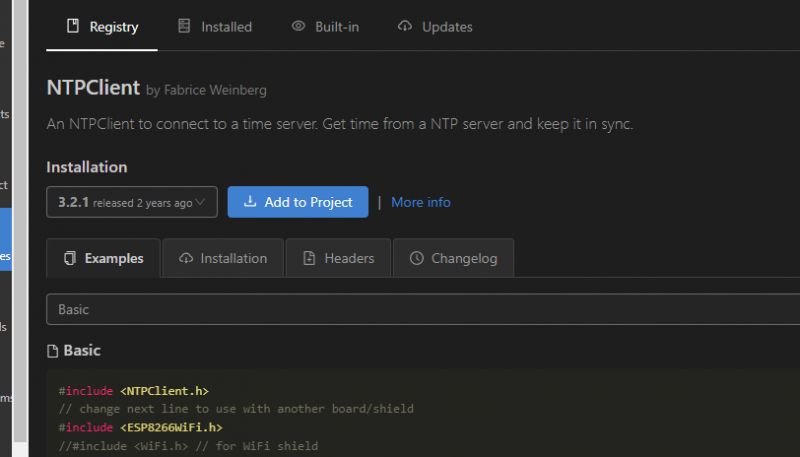
Of course, this library also has a ready-made example of use:
Code: C / C++
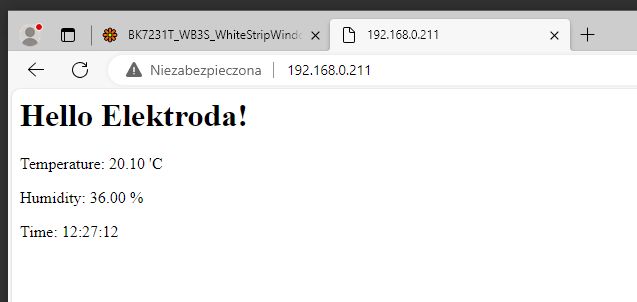
We still need to somehow obtain time in the form of an inscription. There is a ready-made function for this - getFormattedTime . After integration with our website we get:
Code: C / C++
Result:
If we are ambitious, we can format the time ourselves as we wish. We have a function for this strftime , which works similarly to spritnf . We also format the time using special tags. Below is a slightly developed example:
Code: C / C++
Better organization
However, our goal is to collect measurements. Before we implement it, I suggest that you better organize your measurement records. Let`s introduce a structure to represent the measurement. But what should such a structure contain? We will include:
- temperature (float)
- humidity (also float)
- time (here it is best to use the time_t type, which is in fact also a number, I do not recommend writing time as a string, it would be inefficient and inconvenient in further processing)
Code: C / C++
You can then create an instance of this structure globally:
Code: C / C++
and our program will work as before, the only important thing is to save the time at the moment of measurement and not create it at the moment of reading the page.
Measurement history - circular buffer - part 1
Now you need to figure out how to store the measurements. You`d like to use a regular table, but what about deleting old measurements? RAM is not infinite.
There is a simple way to do this - we will use it here circular buffer .
A circular buffer is an array-based data structure that allows you to store a certain number of data elements, and when the buffer is full, new data begins to overwrite the oldest. As the name suggests - the index of the element to which we write comes full circle here. Appropriate manipulation of the array index (along with the appropriate method of reading and writing) makes it become a circular buffer.
Let`s first decide on the size of the board - if we want to have a day of measurements, where measurements are taken every 10 minutes, then 24 * 6 will be enough.
Code: C / C++
We also need the index of the last measurement (this index will "circle" around the array, it will loop):
Code: C / C++
A function that adds a measurement (and loops through the index using the modulo operator):
Code: C / C++
And the table clearing function:
Code: C / C++
Of course, this also needs to be included in downloading measurements from DHT:
Code: C / C++
and their display (no chart at the moment):
Code: C / C++
Finally a chart
Now it`s time to create the chart. We will generate it similarly to the related topic: Drawing charts in HTML on Arduino R4 - statistics, measurements on a mini website .
I decided to use a library for this chart.js
On the W3schools website you can find examples of its use:
https://www.w3schools.com/js/js_graphics_chartjs.asp
Quoting the example from the website above - it all comes down to plugging our collected values into arrays:
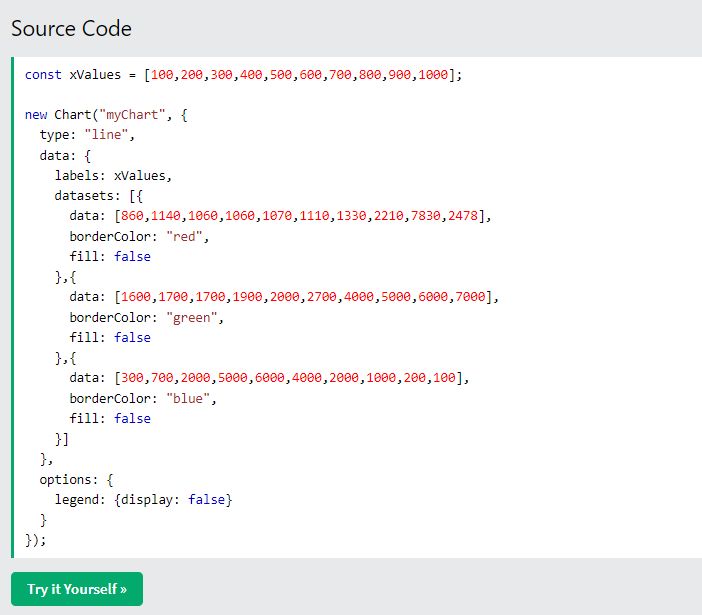
The above code will generate a chart like this:
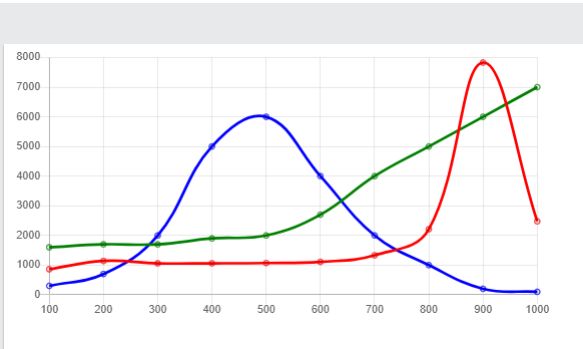
Arrays are characterized by the fact that all elements except the first one are preceded by a comma, which we also have to handle, probably using some if.
We create three arrays:
- labels (markings, dates/times here)
- temperature values
- humidity values
Sample solution:
Code: C / C++
The above solution ignores the circular buffer for now!
Additionally, I break the loop early to skip "empty" measurements.
Then we need to place the tables generated in this way in the rest of the code generating the chart, which we can take from examples of using this library:
Code: C / C++
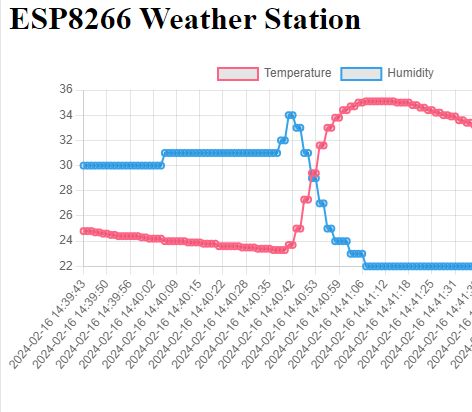
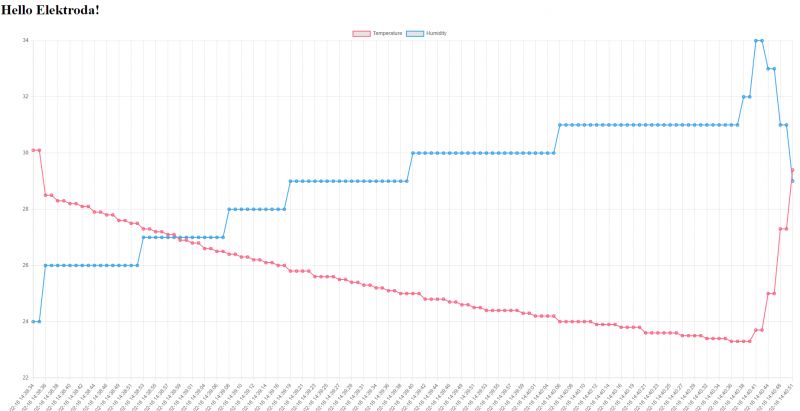
Here is the result, for the effect I heated the sensor with a powerful flashlight:
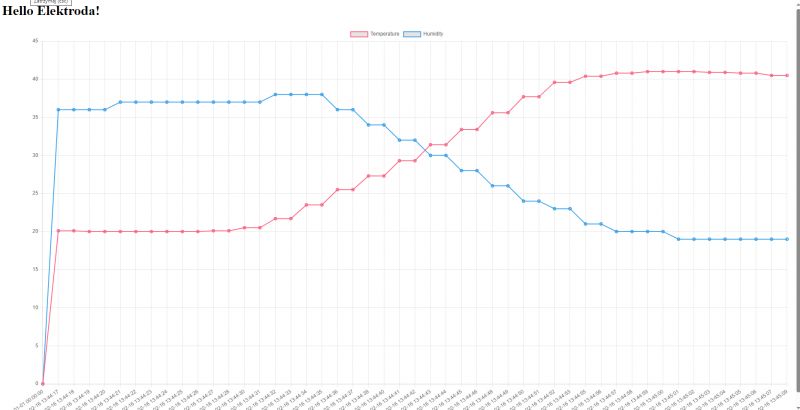
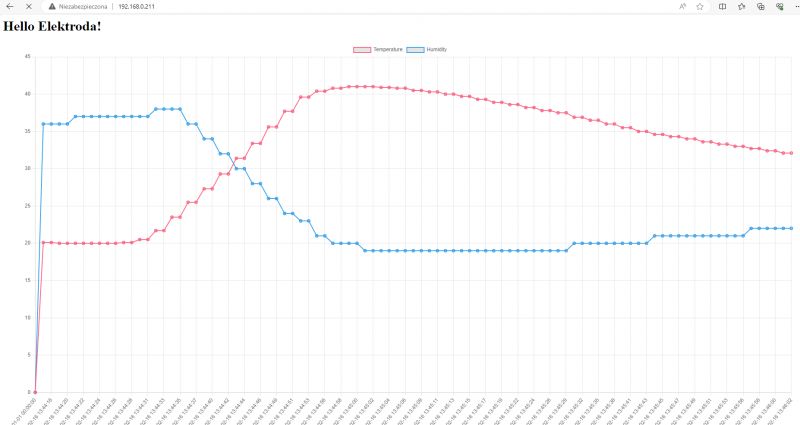
Fixes and improvements
The code in the previous paragraph is not correct. We must respect the circular buffer and ignore empty measurements. The measurement is empty if the time is equal to 0, and we start the buffer iteration from the oldest entry, which we identify as:
(lastSample+1)%SAMPLES_COUNT
the % operator is modulo, the remainder when divided by an integer. This way we start with the oldest entry and end with lastSample.
Code: C / C++
You can still show the result here, but in terms of appearance nothing will change (well, unless we wait longer, then without the correction to the circular buffer the graph could break):
Measurement frequency, cleaning
Now it is worth separating these 1000 ms of the temperature sampling period into a separate variable. Let`s say:
Code: C / C++
In fact, this entire piece of code should be rewritten, maybe it could be possible to use, for example, a class Ticker , but maybe in the next part.
View full code:
Code: C / C++
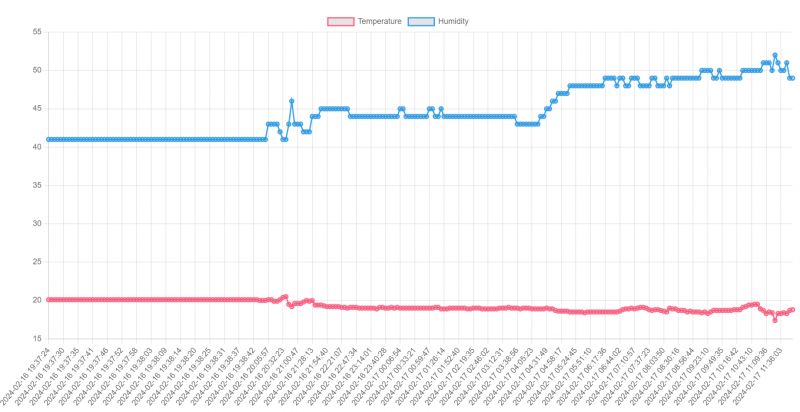
A screenshot of collecting samples over an extended period of time in a slightly modified version of the program:
Summary
A very simple and pleasant design. Just right to start with ESP. After selecting the appropriate number of samples (we are limited by RAM memory) and sampling frequency, you can have nice graphs showing the temperature and humidity for the last few days.
Of course, this is just a small example and there is much room for improvement, e.g.:
- aesthetics (dividing the chart into two units, etc.)
- code (mentioned Ticker would come in handy)
- configurability (you could connect WiFiManager to avoid the need to hard-code our SSID and password)
- it would also be useful to check before the first measurement whether the time from NTP has already been downloaded, if not, skip the measurement
Perhaps I will deal with this in the next part, but for now I invite you to comment. Have you implemented this type or a similar project at ESP? Or maybe someone will be tempted to develop the seed I provided here and turn it into a full-fledged system?


Comments
DHT11 used to be an indicator rather than a temperature sensor (it showed whether it was rising or falling ;D). How does it work better now? [Read more]
Basically I can only agree. There are also slightly better sensors, for example BME280: https://obrazki.elektroda.pl/9254153600_1712817719_thumb.jpg A beginner can treat this as an exercise and convert... [Read more]
and the SHT3x series measures temp&humi and is praised :) [Read more]
I recognize SHT3X, I sometimes see it in Tuya products: https://www.elektroda.com/rtvforum/find.php?q=SHT3X+Tuya Interestingly, there are temperature sensors with an "alarm" function, which allows you... [Read more]
My budget replacement for BMP280 is BME280+AHT20 in one module. The disadvantages that I noticed after almost 6 months on 4 systems are the difference of one 1`C-1.1`C between AHT and BME and the need... [Read more]
I have `quick question` , because I was very interested in this project on ESP8266 -> Were there any tests carried out, how many measurements will enter the RAM memory of this ESP8266, let`s say the... [Read more]
@mariomario, you have information on the Internet how much RAM is on ESP8266, but the question is, are you sure you want to use RAM? So that it disappears after a power loss? Maybe it`s better to use some... [Read more]
In the option as above, approximately 46kb of RAM will be used for 30 days. You can optimize the capacity because 16 bytes per measurement is a lot of data. [Read more]
Every 15 minutes a reading gives us 4 readings per hour, or 96 per day. 30 days is 30*96 = 2880 readings Indeed, if this time_t is 64-bit, with a measurement structure of size 16 bytes we get 46kB, as... [Read more]
I don`t know about other forum members, but in my opinion a project like this would be nice, which after entering the web interface shows the current (current) temperature and humidity reading along with... [Read more]
This means that you would also need to connect WiFiManager so that you do not have to enter network data. I can`t estimate it in my memory, but you should consider whether you want to send all 2880... [Read more]
This would definitely improve the experience of using such a thermometer :) (the only question is how much memory will be left for the reading data?) Even without the optimizations discussed above,... [Read more]
I haven`t played much with advanced JavaScript and I`m not at the top in this language, but I rather thought that the measurements were sent to the browser as text, not as binary data. So, for example,... [Read more]
Hello! I will be happy to show you how you can download a binary file from the Internet using the GET method and parse it in JavaScript to extract 16-bit integer and 32-bit integer values from it. I... [Read more]
@mariomario, I think you`re right that there`s no point in packing bit by bit. I`m exaggerating a bit out of habit, because I have created/am making systems where I fight for every bit, etc. If you were... [Read more]
Welcome back! Parsing the complex data format from a `DataView` object requires a special approach because we will be working at the bit level. In your case, we are dealing with a total of 40 bits of... [Read more]
I see that in JS it basically looks like what I would do in C. [Read more]