Power Supply Design Notes: Thermal Simulations
With the rising use of power technology, it is now necessary to monitor not only the electrical and electronic performance of the components but also their thermal behavior. The adoption of a generic model of a heatsink is highly important for ensuring that the safe operating area (SOA) of a specific power component is not exceeded during a simulation with LTspice. In this tutorial, we will learn how to insert the SOAtherm-HeatSink model and control the behavior of the system in the thermal domain.
Heatsinks and the SOAtherm-HeatSink model
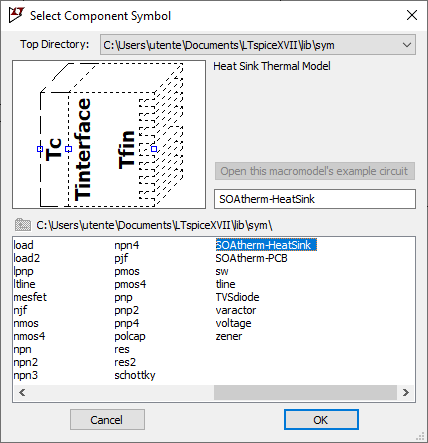
Any electronic power system requires a device that can allow a high heat exchange between the component container and the surrounding environment. This precaution avoids the destruction of the components if the relative junction temperature exceeds its physical limits. In an electronic simulation, LTspice provides a very useful and sophisticated model to simulate the behavior of a heatsink (see Figure 1), providing some essential operational parameters. It is important that the SPICE models of the devices are all equipped with the “Tc” terminal and, optionally, the “Tj” terminal. SOAtherm-HeatSink is the name of the model found in the software library.

Figure 1: The SOAtherm-HeatSink model in the main LTspice library
After you’ve placed the model on the schematic, you need to specify the following information:
• The material of the heatsink can be either copper or aluminum, your choice through the relative dropdown menu.
• Rθ is the heatsink’s thermal resistance, as well as the air flow (˚C/W).
• Tambient is the ambient temperature, expressed in degrees Celsius.
• Area of contact between the electronic component and the heatsink is expressed in square millimeters.
• The total volume of the heatsink is expressed in cubic millimeters.
All of the above parameters must be entered into the properties of the heatsink, which can be accessed by pressing the right mouse button on the schematic component. They must be entered into the SpiceModel, Value, and Value2 fields.
Example of application scheme
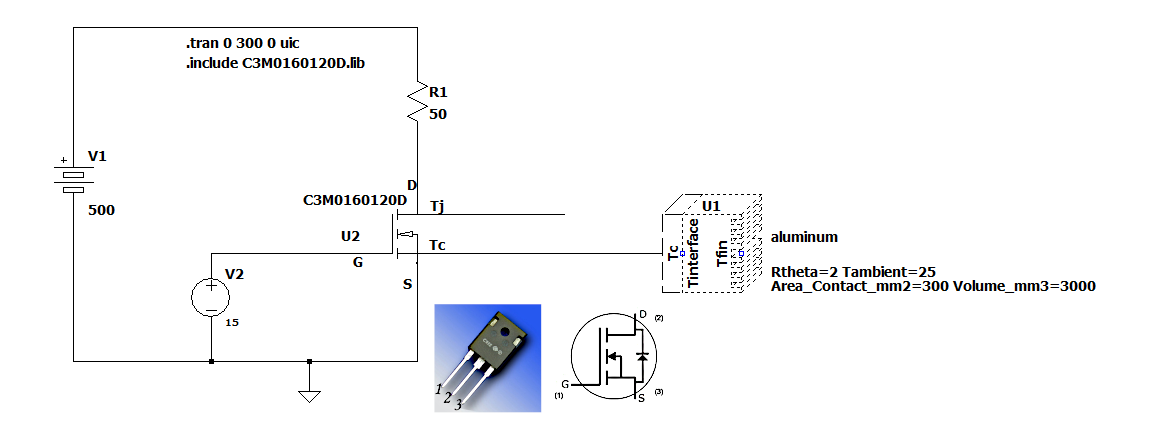
Figure 2 shows an example of an application that allows the use of a SiC MOSFET with an electronic switch function. The model of the device used is the C3M0160120D, with the following characteristics:
• Vds: 1,200 V
• Id: 17 A, 25˚C
• RDS(on): 160 mΩ
• Gate voltage in static regime: from –4 V to 15 V
• Maximum dissipation: 97 W
The circuit’s goal is to get the SiC MOSFET to work in a saturation mode with a very stable load, which necessitates the use of a heatsink. There is no PWM signal, and the system is in static mode. The MOSFET’s gate is fed with a constant direct voltage to close the main circuit and allow the maximum current to flow through the load R1.
The electronic components that make up the system are as follows:
• V1: 500-V main power supply generator
• R1: Very robust load of 50 Ω
• U2: C3M0160120D SiC MOSFET
• V2: 15-V DC voltage generator for direct driving of the MOSFET gate
• SiC MOSFET model connected to a heat sink

Figure 2: SiC MOSFET model connected to a heatsink and inserted as a SOAtherm model in the application wiring diagram
• Vds: 2.17 V
• I (R1): 9.95 A
• Vds: 2.17 V
• I (R1): 9.95 A
• Pd (R1): 7.1 kW
• Pd (MOSFET): 21.6 W
• RDS(on): R = V / I = 218 mΩ
• Efficiency: 99.56%
As you can see, the efficiency is very high, but with these power levels and, more importantly, current values, a good heatsink is required to keep the device operating at a safe temperature. Now, let’s size the SOAtherm-HeatSink model using the following parameters:
• Heatsink material: Aluminum
• Rθ: 2˚C/W
• Tambient: 25˚C
• Area of contact: 300 mm2
• Volume: 3,000 mm3 (the heatsink in this case measures 50 × 30 × 2 mm)
Simulation
Now you can initiate the simulation, keeping in mind that the “Use initial conditions” UIC option should be enabled. You can then use the mouse to view the signals relating to:
• Voltage: By clicking on the corresponding power lines
• Currents: By clicking on the components
• Power: By clicking on the components and pressing the Alt key on the keyboard at the same time
To check the temperature of the component’s “case” (as well as the temperature of the MOSFET junction), simply click on the line that connects the node “Tc” with the heatsink, as shown in the wiring diagram.
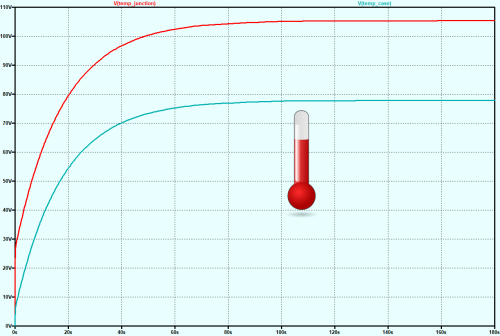
The software, as shown in Figure 3, displays the temperature trend, even though the scale displays it as an electrical voltage.
The values expressed in degrees Celsius must be taken into account.

Figure 3: The graph shows the “case” and “junction” temperature values and must be interpreted as degrees Celsius.
Let’s take a closer look at the graph. The curves are calculated in the time domain, and the temperature is represented on the x-axis, though in volts. With an ambient temperature of 25˚C (previously set in the parameters of the SOAtherm model), the equilibrium point is reached after about two minutes (120 seconds). The heatsink allows the MOSFET to operate safely, and the operating temperatures of the device at the end of the thermal transient are as follows:
• “Junction” temperature: 105˚C
• “Case” temperature: 78˚C
In this simulation, the MOSFET works quite well because the values of voltage, current, power, and junction temperature are much lower than the maximum limits set by the manufacturer. Trying to use different loads with resistance between 50 Ω and 150 Ω through a stepping simulation:
.step param Load 50 150 10
As also demonstrated by the graph in figure 4, the following temperatures of the “case” are obtained when the equilibrium point is reached:
• Load 50 Ω: 77.8˚C
• Load 60 Ω: 57.0˚C
• Load 70 Ω: 47.0˚C
• Load 80 Ω: 41.2˚C
• Load 90 Ω: 37.4˚C
• Load 100 Ω: 34.9˚C
• Load 110 Ω: 33.0˚C
• Load 120 Ω: 31.7˚C
• Load 130 Ω: 30.6˚C
• Load 140 Ω: 29.8˚C
• Load 150 Ω: 29.2˚C

Figure 4: The temperatures of the “case” as the load varies
Conclusion
There is an increasing number of SPICE models that include functions for simulating thermal behavior, which is critical in today’s power projects. Implementing a PWM drive of the MOSFET and attempting to size the heatsink differently, both in size and material, could be a variation on the previous example. Obviously, such a simulation is extremely slow. You can try to reduce the software simulation tolerances in this case. When it comes to thermal simulation, the simulator’s performance is crucial. Some voltage and current values can cause processing to slow down significantly. As a result, some of these parameters must be tweaked slightly.
With the rising use of power technology, it is now necessary to monitor not only the electrical and electronic performance of the components but also their thermal behavior. The adoption of a generic model of a heatsink is highly important for ensuring that the safe operating area (SOA) of a specific power component is not exceeded during a simulation with LTspice. In this tutorial, we will learn how to insert the SOAtherm-HeatSink model and control the behavior of the system in the thermal domain.
Heatsinks and the SOAtherm-HeatSink model
Any electronic power system requires a device that can allow a high heat exchange between the component container and the surrounding environment. This precaution avoids the destruction of the components if the relative junction temperature exceeds its physical limits. In an electronic simulation, LTspice provides a very useful and sophisticated model to simulate the behavior of a heatsink (see Figure 1), providing some essential operational parameters. It is important that the SPICE models of the devices are all equipped with the “Tc” terminal and, optionally, the “Tj” terminal. SOAtherm-HeatSink is the name of the model found in the software library.

Figure 1: The SOAtherm-HeatSink model in the main LTspice library
After you’ve placed the model on the schematic, you need to specify the following information:
• The material of the heatsink can be either copper or aluminum, your choice through the relative dropdown menu.
• Rθ is the heatsink’s thermal resistance, as well as the air flow (˚C/W).
• Tambient is the ambient temperature, expressed in degrees Celsius.
• Area of contact between the electronic component and the heatsink is expressed in square millimeters.
• The total volume of the heatsink is expressed in cubic millimeters.
All of the above parameters must be entered into the properties of the heatsink, which can be accessed by pressing the right mouse button on the schematic component. They must be entered into the SpiceModel, Value, and Value2 fields.
Example of application scheme
Figure 2 shows an example of an application that allows the use of a SiC MOSFET with an electronic switch function. The model of the device used is the C3M0160120D, with the following characteristics:
• Vds: 1,200 V
• Id: 17 A, 25˚C
• RDS(on): 160 mΩ
• Gate voltage in static regime: from –4 V to 15 V
• Maximum dissipation: 97 W
The circuit’s goal is to get the SiC MOSFET to work in a saturation mode with a very stable load, which necessitates the use of a heatsink. There is no PWM signal, and the system is in static mode. The MOSFET’s gate is fed with a constant direct voltage to close the main circuit and allow the maximum current to flow through the load R1.
The electronic components that make up the system are as follows:
• V1: 500-V main power supply generator
• R1: Very robust load of 50 Ω
• U2: C3M0160120D SiC MOSFET
• V2: 15-V DC voltage generator for direct driving of the MOSFET gate
• SiC MOSFET model connected to a heat sink

Figure 2: SiC MOSFET model connected to a heatsink and inserted as a SOAtherm model in the application wiring diagram
• Vds: 2.17 V
• I (R1): 9.95 A
• Vds: 2.17 V
• I (R1): 9.95 A
• Pd (R1): 7.1 kW
• Pd (MOSFET): 21.6 W
• RDS(on): R = V / I = 218 mΩ
• Efficiency: 99.56%
As you can see, the efficiency is very high, but with these power levels and, more importantly, current values, a good heatsink is required to keep the device operating at a safe temperature. Now, let’s size the SOAtherm-HeatSink model using the following parameters:
• Heatsink material: Aluminum
• Rθ: 2˚C/W
• Tambient: 25˚C
• Area of contact: 300 mm2
• Volume: 3,000 mm3 (the heatsink in this case measures 50 × 30 × 2 mm)
Simulation
Now you can initiate the simulation, keeping in mind that the “Use initial conditions” UIC option should be enabled. You can then use the mouse to view the signals relating to:
• Voltage: By clicking on the corresponding power lines
• Currents: By clicking on the components
• Power: By clicking on the components and pressing the Alt key on the keyboard at the same time
To check the temperature of the component’s “case” (as well as the temperature of the MOSFET junction), simply click on the line that connects the node “Tc” with the heatsink, as shown in the wiring diagram.
The software, as shown in Figure 3, displays the temperature trend, even though the scale displays it as an electrical voltage.
The values expressed in degrees Celsius must be taken into account.

Figure 3: The graph shows the “case” and “junction” temperature values and must be interpreted as degrees Celsius.
Let’s take a closer look at the graph. The curves are calculated in the time domain, and the temperature is represented on the x-axis, though in volts. With an ambient temperature of 25˚C (previously set in the parameters of the SOAtherm model), the equilibrium point is reached after about two minutes (120 seconds). The heatsink allows the MOSFET to operate safely, and the operating temperatures of the device at the end of the thermal transient are as follows:
• “Junction” temperature: 105˚C
• “Case” temperature: 78˚C
In this simulation, the MOSFET works quite well because the values of voltage, current, power, and junction temperature are much lower than the maximum limits set by the manufacturer. Trying to use different loads with resistance between 50 Ω and 150 Ω through a stepping simulation:
.step param Load 50 150 10
As also demonstrated by the graph in figure 4, the following temperatures of the “case” are obtained when the equilibrium point is reached:
• Load 50 Ω: 77.8˚C
• Load 60 Ω: 57.0˚C
• Load 70 Ω: 47.0˚C
• Load 80 Ω: 41.2˚C
• Load 90 Ω: 37.4˚C
• Load 100 Ω: 34.9˚C
• Load 110 Ω: 33.0˚C
• Load 120 Ω: 31.7˚C
• Load 130 Ω: 30.6˚C
• Load 140 Ω: 29.8˚C
• Load 150 Ω: 29.2˚C

Figure 4: The temperatures of the “case” as the load varies
Conclusion
There is an increasing number of SPICE models that include functions for simulating thermal behavior, which is critical in today’s power projects. Implementing a PWM drive of the MOSFET and attempting to size the heatsink differently, both in size and material, could be a variation on the previous example. Obviously, such a simulation is extremely slow. You can try to reduce the software simulation tolerances in this case. When it comes to thermal simulation, the simulator’s performance is crucial. Some voltage and current values can cause processing to slow down significantly. As a result, some of these parameters must be tweaked slightly.
Cool? Ranking DIY


