How to Optimally Measure Harmonic Distortion

Harmonic distortion is the distortion of a waveform with respect to another sample wave, usually a sine wave of the same frequency. This type of measurement is extremely useful in many fields, especially in electronics and music. In certain operations, the addition of a small percentage of distortion can result in an improvement of the signal, such as the case with distortion in electric guitars to embellish the sound, but in other contexts, a small percentage of harmonic distortion can become a significant issue. This article shows some ways to measure this value.
The sinusoidal signal
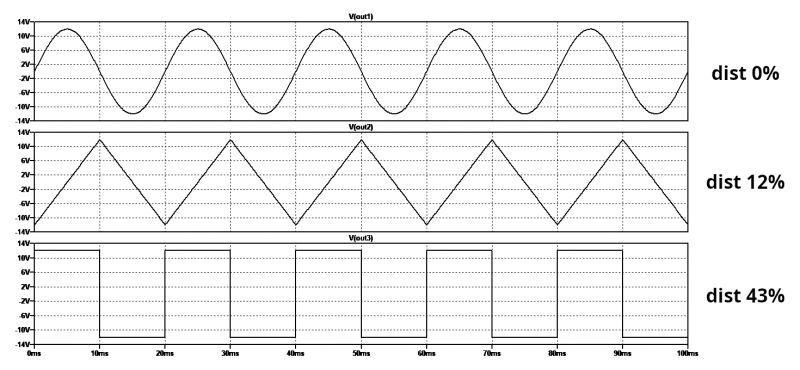
The sinusoidal signal is considered the pure and faultless signal. A sinusoidal sound, in fact, is devoid of hypertones; namely, other components with a frequency higher than the fundamental. If the hypertones have a frequency multiple to the fundamental frequency, they are called harmonics. The analysis of a signal and the observation of its generated frequencies is carried out through the production of the spectrogram. Some very complex devices can be damaged by non-pure signals, especially if the upper harmonics are high. As mentioned, harmonic distortion in music changes the quality of sound, but there are cases when it is a positive aspect and others when it might become a critical concern. Figure 1 shows three types of 50-Hz signals with different harmonic distortion rates:
• The first signal, above, is a pure sine wave, characterized by a frequency of 50 Hz and a peak-to-peak voltage of 24 Vpp (Vout1). Its harmonic distortion is, of course, 0%.
• The second signal, in the center, is a triangular signal, also characterized by a frequency of 50 Hz and a peak-to-peak voltage of 24 Vpp (Vout2). Its harmonic distortion is greater than the previous one, i.e., 12%.
• The third signal, below, is a square wave, characterized by a frequency of 50 Hz and a peak-to-peak voltage of 24 Vpp (Vout3) and a duty cycle of 50%. Its harmonic distortion is about 43%.
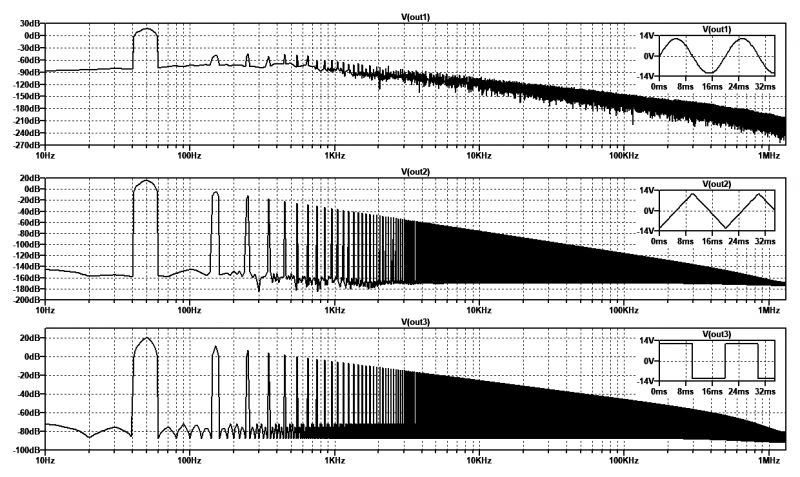
It is also very interesting to observe the three signals related to the corresponding frequency spectra, processed by fast Fourier transform (FFT), with the time domain graphs shown in Figure 2. The first spectrogram at the top, relating to the sine wave, shows only a carrier signal at the frequency of 50 Hz of the intensity of about 18 dB. There are then no upper harmonics, and the signal is pure. The second spectrogram in the middle, relating to the triangular wave, shows the main frequency of 50 Hz with an intensity of about 17 dB. There is the presence of odd harmonics of 150 Hz (–2.5 dB), 250 Hz (–11 dB), 350 Hz (–17 dB), 450 Hz (–21 dB) and so on. The third spectrogram below, relating to the square wave, shows the main frequency of 50 Hz with an intensity of about 20 dB. There is the presence of odd harmonics of 150 Hz (11 dB), 250 Hz (6.7 dB), 350 Hz (3.6 dB), 450 Hz (1.5 dB) and so on. The upper harmonics are of greater intensity than the previous signals, and for this reason, they are the most distorted of all.
How to measure harmonic distortion with a spectrum analyzer
Having access to a spectrum analyzer, even one with medium performance, makes it possible to measure total harmonic distortion (THD) by performing some mathematical operations. If a signal is affected by harmonic distortion, it is distorted, as there is the presence of multiple unwanted signals. There is a number of electronic instruments available on the market that allow this value to be measured. Some use filtering systems that remove the fundamental frequency and then measure the rest of the remaining signals. The same measurement can be made using a simple spectrum analyzer, either standalone or connected to a computer. There is a fairly simple formula for calculating harmonic distortion that involves taking the RMS values of the fundamental frequency and harmonic frequencies, as is described in the following mathematical relationship:

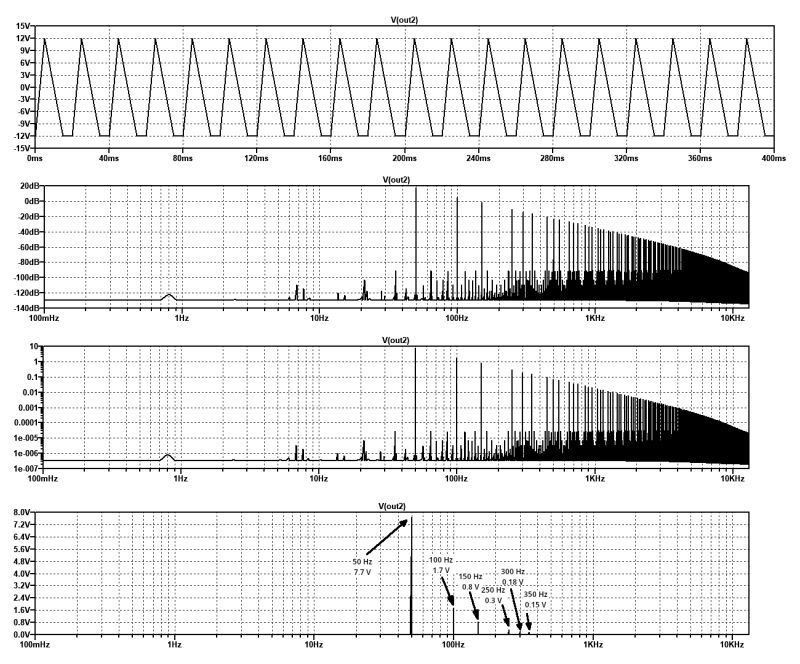
A good result is obtained by considering at least eight upper harmonics. In general, the more harmonics considered in the calculation, the more accurate the final result will be. Consider Figure 3, in which a signal similar to a triangle wave and a sawtooth wave is analyzed.
Such a periodic signal has the following characteristics:
• V(initial): –12 V
• V(on): 12 V
• Delay: 0 ms
• T(rise): 5 ms
• T(fall): 10 ms
• T(on): 0 ms
• T(period): 20 ms
• Frequency: 50 Hz
In the same figure, it is possible to observe the spectrogram expressed in decibels, scaled logarithmically and linearly in RMS voltage, which is used to perform the above formula.

Figure 3: An example of a quasi-triangular signal with its spectrograms in decibels, logarithmic and linear
The RMS voltages of the main frequency and harmonic frequencies have the following amplitudes:
• 50 Hz: 7.7 V
• 100 Hz: 1.7 V
• 150 Hz: 800 mV
• 250 Hz: 300 mV
• 300 Hz: 180 mV
• 350 Hz: 150 mV
• 450 Hz: 95 mV
• 550 Hz: 63 mV
• 650 Hz: 45 mV
• 700 Hz: 35 mV
• 750 Hz: 34 mV
Substituting these values into the formula, the final result is as follows:

This value is not very different from the theoretical value, also calculated with electronic simulators (e.g., with LTspice), which is 25.52%, but the latter is calculated by referring to tens-of-higher harmonics. Note that the directive for performing FFT calculation with SPICE simulators is:

Conclusion
Harmonic distortion calculation is extremely important in so many fields, and its application is useful in uncovering design flaws. Moreover, such calculation is a prerogative of only a few laboratories, so analytical work is certainly valued by one’s clients.

Harmonic distortion is the distortion of a waveform with respect to another sample wave, usually a sine wave of the same frequency. This type of measurement is extremely useful in many fields, especially in electronics and music. In certain operations, the addition of a small percentage of distortion can result in an improvement of the signal, such as the case with distortion in electric guitars to embellish the sound, but in other contexts, a small percentage of harmonic distortion can become a significant issue. This article shows some ways to measure this value.
The sinusoidal signal
The sinusoidal signal is considered the pure and faultless signal. A sinusoidal sound, in fact, is devoid of hypertones; namely, other components with a frequency higher than the fundamental. If the hypertones have a frequency multiple to the fundamental frequency, they are called harmonics. The analysis of a signal and the observation of its generated frequencies is carried out through the production of the spectrogram. Some very complex devices can be damaged by non-pure signals, especially if the upper harmonics are high. As mentioned, harmonic distortion in music changes the quality of sound, but there are cases when it is a positive aspect and others when it might become a critical concern. Figure 1 shows three types of 50-Hz signals with different harmonic distortion rates:
• The first signal, above, is a pure sine wave, characterized by a frequency of 50 Hz and a peak-to-peak voltage of 24 Vpp (Vout1). Its harmonic distortion is, of course, 0%.
• The second signal, in the center, is a triangular signal, also characterized by a frequency of 50 Hz and a peak-to-peak voltage of 24 Vpp (Vout2). Its harmonic distortion is greater than the previous one, i.e., 12%.
• The third signal, below, is a square wave, characterized by a frequency of 50 Hz and a peak-to-peak voltage of 24 Vpp (Vout3) and a duty cycle of 50%. Its harmonic distortion is about 43%.
It is also very interesting to observe the three signals related to the corresponding frequency spectra, processed by fast Fourier transform (FFT), with the time domain graphs shown in Figure 2. The first spectrogram at the top, relating to the sine wave, shows only a carrier signal at the frequency of 50 Hz of the intensity of about 18 dB. There are then no upper harmonics, and the signal is pure. The second spectrogram in the middle, relating to the triangular wave, shows the main frequency of 50 Hz with an intensity of about 17 dB. There is the presence of odd harmonics of 150 Hz (–2.5 dB), 250 Hz (–11 dB), 350 Hz (–17 dB), 450 Hz (–21 dB) and so on. The third spectrogram below, relating to the square wave, shows the main frequency of 50 Hz with an intensity of about 20 dB. There is the presence of odd harmonics of 150 Hz (11 dB), 250 Hz (6.7 dB), 350 Hz (3.6 dB), 450 Hz (1.5 dB) and so on. The upper harmonics are of greater intensity than the previous signals, and for this reason, they are the most distorted of all.
How to measure harmonic distortion with a spectrum analyzer
Having access to a spectrum analyzer, even one with medium performance, makes it possible to measure total harmonic distortion (THD) by performing some mathematical operations. If a signal is affected by harmonic distortion, it is distorted, as there is the presence of multiple unwanted signals. There is a number of electronic instruments available on the market that allow this value to be measured. Some use filtering systems that remove the fundamental frequency and then measure the rest of the remaining signals. The same measurement can be made using a simple spectrum analyzer, either standalone or connected to a computer. There is a fairly simple formula for calculating harmonic distortion that involves taking the RMS values of the fundamental frequency and harmonic frequencies, as is described in the following mathematical relationship:

A good result is obtained by considering at least eight upper harmonics. In general, the more harmonics considered in the calculation, the more accurate the final result will be. Consider Figure 3, in which a signal similar to a triangle wave and a sawtooth wave is analyzed.
Such a periodic signal has the following characteristics:
• V(initial): –12 V
• V(on): 12 V
• Delay: 0 ms
• T(rise): 5 ms
• T(fall): 10 ms
• T(on): 0 ms
• T(period): 20 ms
• Frequency: 50 Hz
In the same figure, it is possible to observe the spectrogram expressed in decibels, scaled logarithmically and linearly in RMS voltage, which is used to perform the above formula.

Figure 3: An example of a quasi-triangular signal with its spectrograms in decibels, logarithmic and linear
The RMS voltages of the main frequency and harmonic frequencies have the following amplitudes:
• 50 Hz: 7.7 V
• 100 Hz: 1.7 V
• 150 Hz: 800 mV
• 250 Hz: 300 mV
• 300 Hz: 180 mV
• 350 Hz: 150 mV
• 450 Hz: 95 mV
• 550 Hz: 63 mV
• 650 Hz: 45 mV
• 700 Hz: 35 mV
• 750 Hz: 34 mV
Substituting these values into the formula, the final result is as follows:

This value is not very different from the theoretical value, also calculated with electronic simulators (e.g., with LTspice), which is 25.52%, but the latter is calculated by referring to tens-of-higher harmonics. Note that the directive for performing FFT calculation with SPICE simulators is:
Conclusion
Harmonic distortion calculation is extremely important in so many fields, and its application is useful in uncovering design flaws. Moreover, such calculation is a prerogative of only a few laboratories, so analytical work is certainly valued by one’s clients.


