Hello,
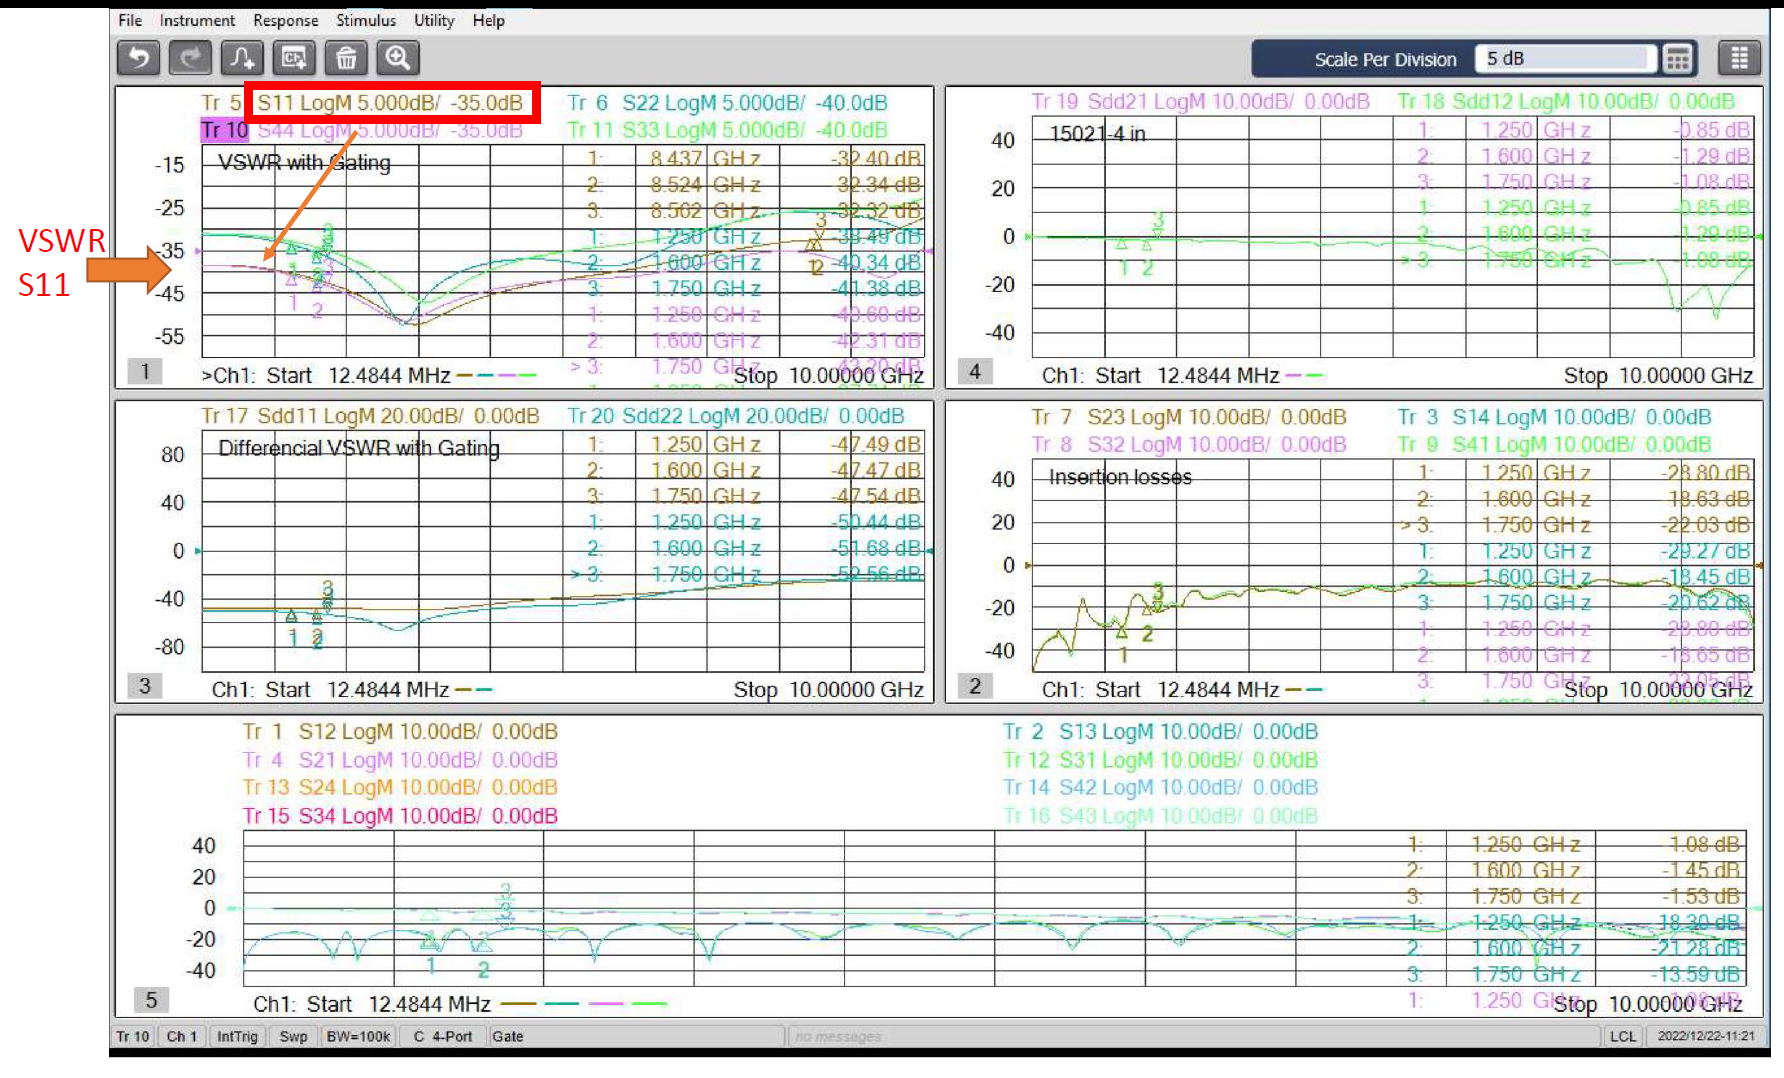
I got VSWR(S11) measurement from a molex flat cable 4 inches long and I want to obtain S11, so I do : S11 = (VSWR-1)/(VSWR - 1) but the result I got is not consistent...
Molex cannot give me the S-parameters files so I want to extract data from graphs.
My aim is to obtain S11 and then use FFT to get TDR response on it so I can after get TDR of impedance along the line.
My experimental data are the one below :

I import the value to Matlab using a tool to extract the data :

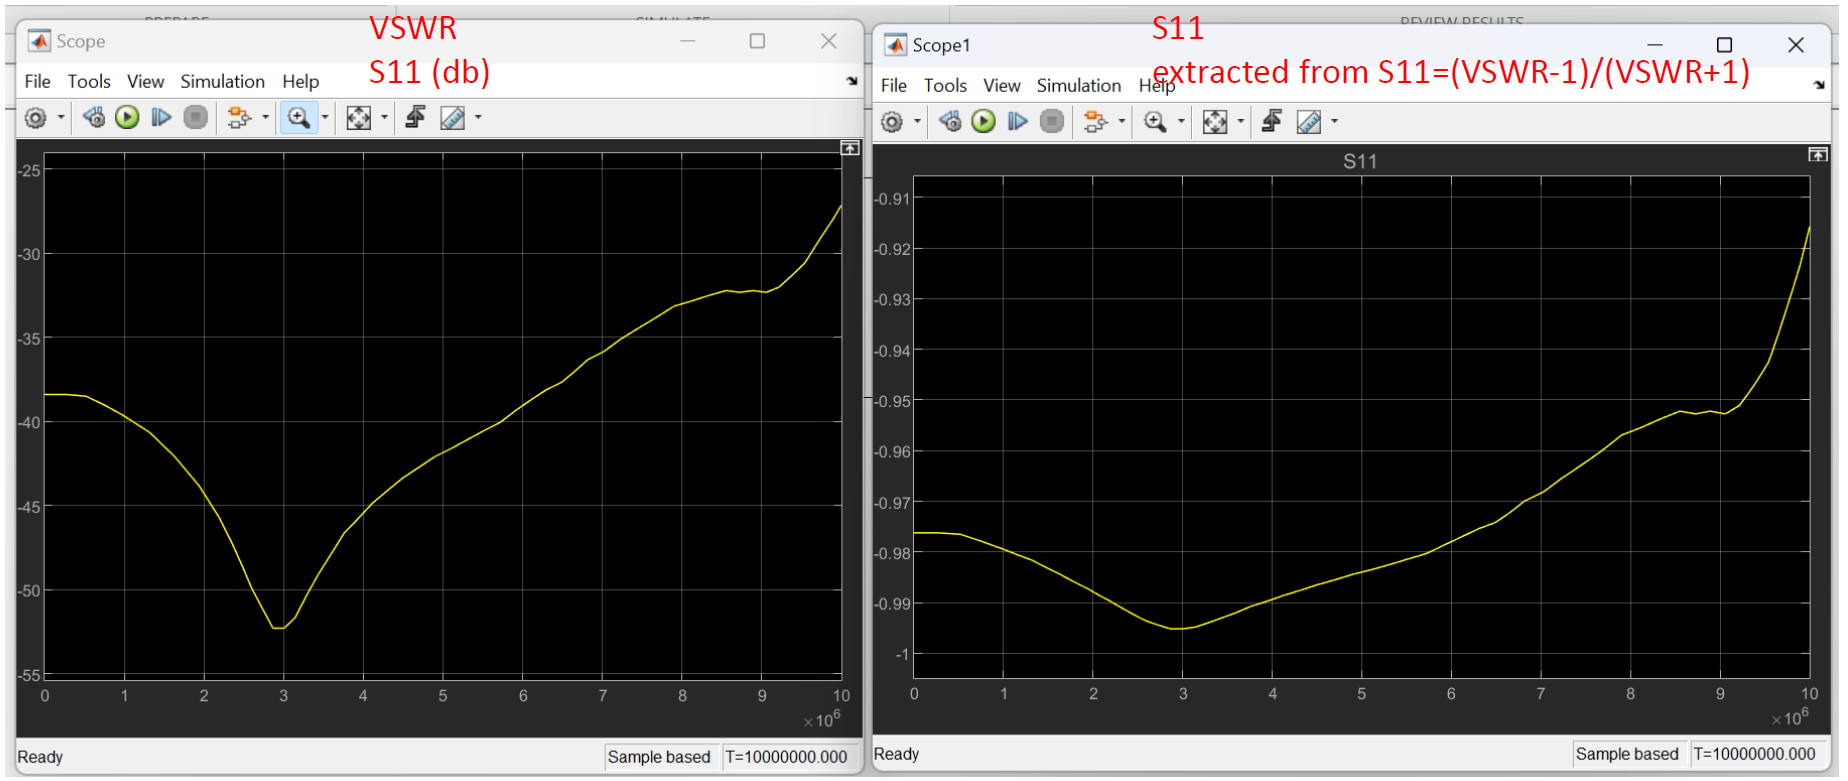
and after extracting the magnitude from the db and done the math in Matlab and I got this :

Normaly S11 would be something periodic along the frequencies like the one below but it is not the result I got ...

Any idea ? Thank you !
AI: Could you provide more details on the tool or method you used to extract data from the graphs?
PlotDigitizer
AI: What is the frequency range and resolution of your VSWR measurements?
12MHz - 10 GHz
I got VSWR(S11) measurement from a molex flat cable 4 inches long and I want to obtain S11, so I do : S11 = (VSWR-1)/(VSWR - 1) but the result I got is not consistent...
Molex cannot give me the S-parameters files so I want to extract data from graphs.
My aim is to obtain S11 and then use FFT to get TDR response on it so I can after get TDR of impedance along the line.
My experimental data are the one below :

I import the value to Matlab using a tool to extract the data :

and after extracting the magnitude from the db and done the math in Matlab and I got this :

Normaly S11 would be something periodic along the frequencies like the one below but it is not the result I got ...

Any idea ? Thank you !
AI: Could you provide more details on the tool or method you used to extract data from the graphs?
PlotDigitizer
AI: What is the frequency range and resolution of your VSWR measurements?
12MHz - 10 GHz


