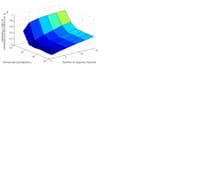
here is the matlab program, when i run it, i m not getting the required result. So if u have any information about it, help me.
here is the coding for it.
x=linspace(0,14,6);
y=logspace(-2,4,6);
[x y] = meshgrid(x, y );
z = x.^2 + y.^.6;
set(gca,'YScale','log','ZLim',[0 3])
surf(z);
xlabel('Number of required channels')
ylabel('Arrival rate (arrivals/sec)')
zlabel('Interference ratio of interference to the macrocell, R_I_F_M')
The graph i want to get is given in image. plz help me..


