Mileage checks should be done with an oscilloscope; Now you cannot say that the signal is too slow, there is a delay in data transfer between the driver and the interface;
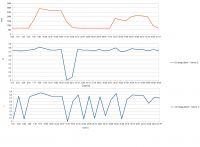
This can be seen in the graph when the engine speed is increased to 3000 rpm. here the graph gives a linear value, and it should look like idling with the difference that these graph fluctuations should occur with a much greater frequency.
It can only be stated whether the fluctuations in the readings do not exceed the value of the correct engine operation, i.e. whether the signal is not less than 100mV or higher than 800mV for the probe upstream of the catalyst (and the signal should oscillate between such values); whether it is overstated or understated (i.e. the upper or lower limit is not present in a different voltage range); or linear;
Second lambda probe
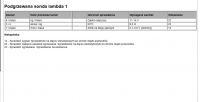
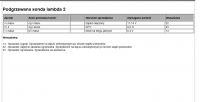
a functional probe with an efficient engine (assumption here that the engine is new, no mileage) should show a voltage of 400mV; taking into account the wear of the heating element and the entire engine, and it is not always possible to obtain a reading like the factory measurement (comparative reading), it should give a reading comparable to the first one, however, these vibrations are much smaller and should vibrate around 100mV-200mV; so these fluctuations should oscillate between 300mV-500mV (although it is better to work when the difference is 100mV - as you can see in your case)
The more linear plot of the second probe is a signal to the controller that the oxidation catalyst is operating correctly;
At idle, the graph of the first to the second should show alternating values (and so the first probe shows a high state, the second probe is low, which results from the exhaust gas velocity in the system and the distance between the probes)
With increased revolutions, the pressure and velocity of the gases increase, and thus the graphs of both probes also accelerate.
So much for theory.
As you can see, the signal from the second probe is inflated; 700mV which is a bit too much. These signal fluctuations are also a bit slow relative to the first.
However, it is necessary to take an amendment that the oscillogram would be more precise and it would be possible to show how it really is;
However, here you can see that this voltage is immediately noticeable, and for comparison, take a look at this narrowed chart that you connected to the first post, it goes beautifully at 400mV.
So as not to incur costs, it would be advisable to measure the second probe with a multimeter and then it should be clear whether the readings are correct or the probe is not working properly.
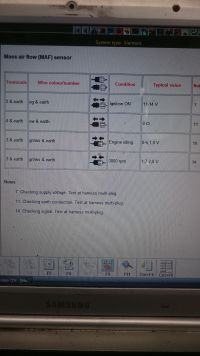
Also look for the values I gave earlier; provided by the manufacturer (e.g. autodata etc.)
Later I will try to put in the values that the multimeter should show when measuring the probe.
PS constant speed outside the city does not say much, because you can go 90 km / h at a speed of around 1500 or 130 km / h and at increased speed.
plus temp and other factors.


