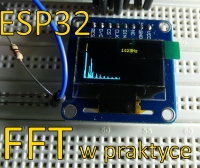
In the material you will find an introduction to the Fourier transform with the theory kept to a minimum. It is a proposal to get acquainted with the topic through practical experiments, then an intuitive sense of what FFT can be useful for. If you are put off by complicated math, this material may be helpful. If mathematics is your element, remember that I will deliberately skip and simplify a lot of things, assuming that you have to start with something and then you can look further on your own. For the experiments we will use the Arduino environment, ESP32 and a monochrome LCD 128x64px display equipped with an SPI bus. The ESP32 module was available in the elektroda.pl gadgets, information on how to configure the Arduino environment to work with ESP32 can be found here: configuration of the Wi-Fi and Bluetooth ESP32 module in Arduino .
In the material you will find photos and videos presenting the results, there is also the code of the program used, which will facilitate your own practical tests.
Fourier transformation allows you to move from the time domain (in practice, for example, a buffer with samples from the ADC - an analog-to-digital converter, downloaded at a specific frequency) to the frequency domain, i.e. in practice, we have information about amplitudes (or, if you prefer, powers) on subsequent frequency bands. You know the time domain well e.g. from the oscilloscope screen, i.e. the successive values of the signal samples in time. You can compare the frequency representation of a signal to turning a knob on a radio receiver and checking the signal level at individual frequencies. You can come across an implementation of a discrete Fourier transform as DFT (discrete Fourier transform), the implementation of which is quite simple (a for loop inside the second for loop operating on input data from the sample buffer), but the computational complexity of DFT is O (N?), I.e. with increasing the amount of input data (buffer length) quickly grows the number of necessary operations (i.e. the transformation execution time). FFT (fast Fourier transform) has a more complicated implementation, but its computational complexity is less O (N * log2 (N)), which allows for faster transformation due to fewer operations required. The amount of input data for an FFT is the power of 2 (e.g. 8,16,32,64,128 etc.).
To add the FFT library to the Arduino environment, select:
Skic-> attach library-> manage libraries
we search for "fft" and select arduinoFFT.
The input signal for the transformation there will be samples from the ADC 12b in the ESP32. We will collect samples with a frequency of 40kHz and they will go to a buffer with a length of 128 samples. Sampling at 40kHz will allow the analysis of input signals up to 20kHz (Nyquist frequency). So the upper limit of the frequency of the signal that we will be able to analyze is half the sampling frequency. The voltage that we can give to the ADC is in the range 0-3.3V, at the testing stage, the signal will be fed through a 10-wire resistor. We will trigger the collection of subsequent samples from the ADC with a timer. When we collect 128 samples, we will run FFT and display the data on the display. The data in the sample buffer before FFT execution is modified by a time window function (e.g. Hanning, Hamming, etc. windows), this reduces spectral leakage and in practice it improves the quality of the data obtained. The operation of multiplying the signal by the time window can be compared to, for example, gently "increasing" the amplitude at the beginning of a piece and "fading out" at its end.
The result of the FFT there will be two data buffers, in each of the buffers the length of usable data will be twice smaller than the length of the input buffer with samples from ADC. Successive pairs of data from buffers will be real and imaginary parts of complex numbers. Graphically, the result of the transformation can be presented as follows:

In the zero element of the output arrays there is information about the constant component of the signal, in the subsequent elements of the array - complex numbers (gray arrows show Re, Im pairs). Complex numbers describe successive frequency bands of the tested real signal. The upper frequency of the tested signal in the example is 20kHz, we have 64 complex numbers, so the width of each band is 312.5Hz. We have 64 points that define the signal in the frequency domain, the first element refers to the frequency of 312.5Hz, the next 625Hz, etc.
It is worth recalling here that:
- sampling rate Fs determines the maximum frequency (Fs / 2) that we can analyze in the input signal
- buffer length N affects the number of FFT points (N / 2), which determines the resolution with which we examine the signal in the frequency domain
- the length of the buffer affects the number of operations needed to perform, i.e. the FFT execution time.
Complex numbers we will present it graphically, putting the real component on the X axis and the imaginary component on the Y axis. An example complex number z = 3 + 4i will look like this:
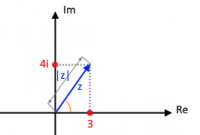
The module of a complex number (arrow length) carries information about the power (amplitude) at a given frequency of the analyzed signal. The modulus of the sample number "z" can be calculated from tw. Pythagoras (the root of the sum of the squares of the hypotenuses) and we get | z | = 5 (the length of the hypotenuse). The angle between the "arrow" and the X axis shows the phase of the signal and can be calculated arctg (Im / Re). Thus we have moved from the time domain to the frequency domain.
LCD display we can handle it by adding the U8g2 library to the Arduino environment:
Skic-> attach library-> manage libraries
we search for ST7565 and choose U8g2.
The used monochrome COG 128x64px graphic LCD display is based on the ST7565 controller and communicates using the SPI bus. Unfortunately, the used version of LCD-AG-C128064CF 128 * 64 ST7565R requires the connection of external 1uF capacitors, but modules with capacitors and SPI pins on the board are available. With the U8g2 library, we do not have to limit ourselves to one type of driver or interface, changing the display initialization settings, we can easily adapt the program code to another type of display https://github.com/olikraus/u8g2/wiki/u8g2setupcpp. For your LCD, the configuration looks like this:
U8G2_ST7565_NHD_C12864_F_4W_HW_SPI u8g2 (U8G2_R0, / * cs = * / 5, / * dc = * / 4, / * reset = * / 16);
Below is a diagram of the display outputs and the way of connecting the capacitors:
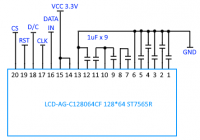
Connection to ESP32 we can make it on a breadboard.
Feed the tested input signal to G34 (ADC input), remembering about the allowable voltage range 0-3.3V
The supply voltage for the LCD is taken from the 3.3V output, similarly to the GND ground.
The boot button (G0) will toggle the program functions (time domain, FFT powers, FFT phase).
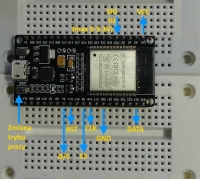
SPI is derived from G18 (CLK), G23 (DATA), G5 (CS).
Additionally, LCD control lines G16 (RST) and G4 (D / C).
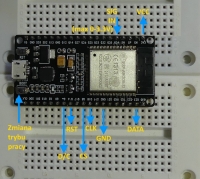
The whole thing when connected to the contact plates looks like this:
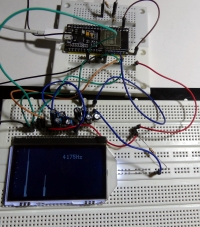
The library does not work well with the selected display and the displayed image is shifted to the right (random dots visible in the vertical bar on the left). The advantage of the display is its large size, which improves readability. If you know how to eliminate the described effect, please write in this topic.
(Offset problem solved thanks to the prompt piotr_go details below.)
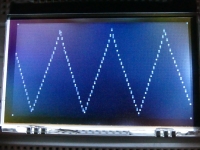
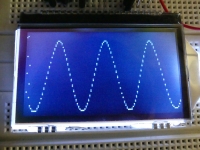
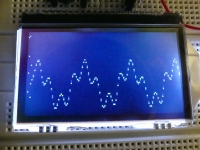
Time domain is well known to anyone who has used an oscilloscope. First, let's check if the sampling works properly and if it is possible to display the buffer contents graphically on the LCD. This is how the program works in the time domain mode in the photo and video:
[movie: b358154f62] https://filmy.elektroda.pl/88_1502723869.mp4 [/ movie: b358154f62]
For simple periodic waveforms one can estimate the frequency, phase and amplitude "by eye", for more complex signals it would be difficult. The input of the system includes signals from two generators, both signals are fed through separate 10k? resistors at the ADC input, we have the sum of the signals from both generators, a wavy sine wave is the effect of giving two sinusoidal signals of different frequencies.
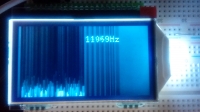
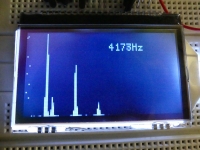
Frequency domain is a display function where we use the results of the FFT operation. The picture below shows the "fringes" on the frequencies corresponding to the frequencies of the signals fed to the ADC input. In the video you will see reducing the frequency of the signal at the output of one generator, then reducing the amplitude of the signal at the output of the other generator. In the lower right corner there is a preview of the oscilloscope screen (time domain).
[movie: b358154f62] https://filmy.elektroda.pl/23_1502725294.mp4 [/ movie: b358154f62]
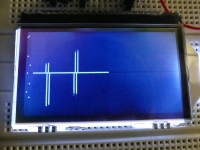
Phase a signal at a given frequency is computable as is the amplitude as described in the section on complex numbers. It is much more popular to determine the amplitude (power) of a signal at a certain frequency. Let's try to draw a phase diagram against frequency. You have to remember that the input signal is not synchronized with the sampling (the sine wave is flowing in the time domain presentation mode). Similarly, in a phase diagram, the value of the phase will gradually change as the sine wave "flows" and the initial phase changes. The second thing is the finite accuracy of the number representation in the computer system and the fact that arctg will be calculated from the ratio of two numbers (often representing noise). Complex numbers with a small modulus value (noise, negligible data) can generate phase information similar to numbers with a large modulus value (frequencies where signal strengths are greater and data is significant). Unlike the modulus value of a complex number, the phase shifts will not show us where the signal with the greater amplitude is, so the phase diagram can resemble noise. Let us introduce the phase calculation only at the points where the modulus of the complex number will exceed the specified threshold value (e.g. 1/100 of the maximum value). Below there is a photo and a video showing a phase graph using such "masking" depending on the value of the complex number modulus, in the video you will notice a continuous change of the phase value, and a recording of the "flowing" sine in the time domain mode.
[movie: b358154f62] https://filmy.elektroda.pl/41_1502726560.mp4 [/ movie: b358154f62]
Connecting a different display using U8g2 is limited to changing one line in the program, and connecting the display to the appropriate SPI outputs. Let's try the OLED display with the SSD1306 driver, which was used during the tests digital UV index sensor SI1132 .
We change the line:
U8G2_ST7565_NHD_C12864_F_4W_HW_SPI u8g2 (U8G2_R0, / * cs = * / 5, / * dc = * / 4, / * reset = * / 16);
on:
U8G2_SSD1306_128X64_NONAME_F_4W_HW_SPI u8g2 (U8G2_R0, 5, 4, 16);
And remove the line: u8g2.setContrast (255);
We connect the display to the appropriate pins of the ESP32 module:
The program displays the data on the new OLED display:
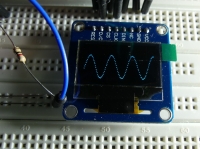
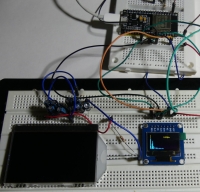
[movie: b358154f62] https://filmy.elektroda.pl/57_1502728200.mp4 [/ movie: b358154f62]
At the input of the system, we can easily send a signal from an electrified microphone:
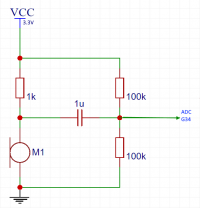
There is an "inverse" IFFT algorithm to the FFT which allows a transition from the frequency domain to the time domain.
Below you can download the Ardino code for ESP32, remember to include the arduinoFFT and U8g2 libraries and adapting the Arduino environment to support ESP32 . The program code can be used on a board other than ESP32 after changes, including triggering sampling and ADC configuration.
Environmental tests Arduino 1.8.3.
What is your idea of using FFT, did you manage to make practical tests, or maybe you have extensive experience in digital signal processing and want to raise DSP-related topics?
In the material you will find photos and videos presenting the results, there is also the code of the program used, which will facilitate your own practical tests.
Fourier transformation allows you to move from the time domain (in practice, for example, a buffer with samples from the ADC - an analog-to-digital converter, downloaded at a specific frequency) to the frequency domain, i.e. in practice, we have information about amplitudes (or, if you prefer, powers) on subsequent frequency bands. You know the time domain well e.g. from the oscilloscope screen, i.e. the successive values of the signal samples in time. You can compare the frequency representation of a signal to turning a knob on a radio receiver and checking the signal level at individual frequencies. You can come across an implementation of a discrete Fourier transform as DFT (discrete Fourier transform), the implementation of which is quite simple (a for loop inside the second for loop operating on input data from the sample buffer), but the computational complexity of DFT is O (N?), I.e. with increasing the amount of input data (buffer length) quickly grows the number of necessary operations (i.e. the transformation execution time). FFT (fast Fourier transform) has a more complicated implementation, but its computational complexity is less O (N * log2 (N)), which allows for faster transformation due to fewer operations required. The amount of input data for an FFT is the power of 2 (e.g. 8,16,32,64,128 etc.).
To add the FFT library to the Arduino environment, select:
Skic-> attach library-> manage libraries
we search for "fft" and select arduinoFFT.
The input signal for the transformation there will be samples from the ADC 12b in the ESP32. We will collect samples with a frequency of 40kHz and they will go to a buffer with a length of 128 samples. Sampling at 40kHz will allow the analysis of input signals up to 20kHz (Nyquist frequency). So the upper limit of the frequency of the signal that we will be able to analyze is half the sampling frequency. The voltage that we can give to the ADC is in the range 0-3.3V, at the testing stage, the signal will be fed through a 10-wire resistor. We will trigger the collection of subsequent samples from the ADC with a timer. When we collect 128 samples, we will run FFT and display the data on the display. The data in the sample buffer before FFT execution is modified by a time window function (e.g. Hanning, Hamming, etc. windows), this reduces spectral leakage and in practice it improves the quality of the data obtained. The operation of multiplying the signal by the time window can be compared to, for example, gently "increasing" the amplitude at the beginning of a piece and "fading out" at its end.
The result of the FFT there will be two data buffers, in each of the buffers the length of usable data will be twice smaller than the length of the input buffer with samples from ADC. Successive pairs of data from buffers will be real and imaginary parts of complex numbers. Graphically, the result of the transformation can be presented as follows:

In the zero element of the output arrays there is information about the constant component of the signal, in the subsequent elements of the array - complex numbers (gray arrows show Re, Im pairs). Complex numbers describe successive frequency bands of the tested real signal. The upper frequency of the tested signal in the example is 20kHz, we have 64 complex numbers, so the width of each band is 312.5Hz. We have 64 points that define the signal in the frequency domain, the first element refers to the frequency of 312.5Hz, the next 625Hz, etc.
It is worth recalling here that:
- sampling rate Fs determines the maximum frequency (Fs / 2) that we can analyze in the input signal
- buffer length N affects the number of FFT points (N / 2), which determines the resolution with which we examine the signal in the frequency domain
- the length of the buffer affects the number of operations needed to perform, i.e. the FFT execution time.
Complex numbers we will present it graphically, putting the real component on the X axis and the imaginary component on the Y axis. An example complex number z = 3 + 4i will look like this:

The module of a complex number (arrow length) carries information about the power (amplitude) at a given frequency of the analyzed signal. The modulus of the sample number "z" can be calculated from tw. Pythagoras (the root of the sum of the squares of the hypotenuses) and we get | z | = 5 (the length of the hypotenuse). The angle between the "arrow" and the X axis shows the phase of the signal and can be calculated arctg (Im / Re). Thus we have moved from the time domain to the frequency domain.
LCD display we can handle it by adding the U8g2 library to the Arduino environment:
Skic-> attach library-> manage libraries
we search for ST7565 and choose U8g2.
The used monochrome COG 128x64px graphic LCD display is based on the ST7565 controller and communicates using the SPI bus. Unfortunately, the used version of LCD-AG-C128064CF 128 * 64 ST7565R requires the connection of external 1uF capacitors, but modules with capacitors and SPI pins on the board are available. With the U8g2 library, we do not have to limit ourselves to one type of driver or interface, changing the display initialization settings, we can easily adapt the program code to another type of display https://github.com/olikraus/u8g2/wiki/u8g2setupcpp. For your LCD, the configuration looks like this:
U8G2_ST7565_NHD_C12864_F_4W_HW_SPI u8g2 (U8G2_R0, / * cs = * / 5, / * dc = * / 4, / * reset = * / 16);
Below is a diagram of the display outputs and the way of connecting the capacitors:

Connection to ESP32 we can make it on a breadboard.
Feed the tested input signal to G34 (ADC input), remembering about the allowable voltage range 0-3.3V
The supply voltage for the LCD is taken from the 3.3V output, similarly to the GND ground.
The boot button (G0) will toggle the program functions (time domain, FFT powers, FFT phase).
SPI is derived from G18 (CLK), G23 (DATA), G5 (CS).
Additionally, LCD control lines G16 (RST) and G4 (D / C).

The whole thing when connected to the contact plates looks like this:

The library does not work well with the selected display and the displayed image is shifted to the right (random dots visible in the vertical bar on the left). The advantage of the display is its large size, which improves readability. If you know how to eliminate the described effect, please write in this topic.
(Offset problem solved thanks to the prompt piotr_go details below.)
Time domain is well known to anyone who has used an oscilloscope. First, let's check if the sampling works properly and if it is possible to display the buffer contents graphically on the LCD. This is how the program works in the time domain mode in the photo and video:


[movie: b358154f62] https://filmy.elektroda.pl/88_1502723869.mp4 [/ movie: b358154f62]
For simple periodic waveforms one can estimate the frequency, phase and amplitude "by eye", for more complex signals it would be difficult. The input of the system includes signals from two generators, both signals are fed through separate 10k? resistors at the ADC input, we have the sum of the signals from both generators, a wavy sine wave is the effect of giving two sinusoidal signals of different frequencies.
Frequency domain is a display function where we use the results of the FFT operation. The picture below shows the "fringes" on the frequencies corresponding to the frequencies of the signals fed to the ADC input. In the video you will see reducing the frequency of the signal at the output of one generator, then reducing the amplitude of the signal at the output of the other generator. In the lower right corner there is a preview of the oscilloscope screen (time domain).

[movie: b358154f62] https://filmy.elektroda.pl/23_1502725294.mp4 [/ movie: b358154f62]
Phase a signal at a given frequency is computable as is the amplitude as described in the section on complex numbers. It is much more popular to determine the amplitude (power) of a signal at a certain frequency. Let's try to draw a phase diagram against frequency. You have to remember that the input signal is not synchronized with the sampling (the sine wave is flowing in the time domain presentation mode). Similarly, in a phase diagram, the value of the phase will gradually change as the sine wave "flows" and the initial phase changes. The second thing is the finite accuracy of the number representation in the computer system and the fact that arctg will be calculated from the ratio of two numbers (often representing noise). Complex numbers with a small modulus value (noise, negligible data) can generate phase information similar to numbers with a large modulus value (frequencies where signal strengths are greater and data is significant). Unlike the modulus value of a complex number, the phase shifts will not show us where the signal with the greater amplitude is, so the phase diagram can resemble noise. Let us introduce the phase calculation only at the points where the modulus of the complex number will exceed the specified threshold value (e.g. 1/100 of the maximum value). Below there is a photo and a video showing a phase graph using such "masking" depending on the value of the complex number modulus, in the video you will notice a continuous change of the phase value, and a recording of the "flowing" sine in the time domain mode.

[movie: b358154f62] https://filmy.elektroda.pl/41_1502726560.mp4 [/ movie: b358154f62]
Connecting a different display using U8g2 is limited to changing one line in the program, and connecting the display to the appropriate SPI outputs. Let's try the OLED display with the SSD1306 driver, which was used during the tests digital UV index sensor SI1132 .
We change the line:
U8G2_ST7565_NHD_C12864_F_4W_HW_SPI u8g2 (U8G2_R0, / * cs = * / 5, / * dc = * / 4, / * reset = * / 16);
on:
U8G2_SSD1306_128X64_NONAME_F_4W_HW_SPI u8g2 (U8G2_R0, 5, 4, 16);
And remove the line: u8g2.setContrast (255);
We connect the display to the appropriate pins of the ESP32 module:

The program displays the data on the new OLED display:


[movie: b358154f62] https://filmy.elektroda.pl/57_1502728200.mp4 [/ movie: b358154f62]
At the input of the system, we can easily send a signal from an electrified microphone:

There is an "inverse" IFFT algorithm to the FFT which allows a transition from the frequency domain to the time domain.
Below you can download the Ardino code for ESP32, remember to include the arduinoFFT and U8g2 libraries and adapting the Arduino environment to support ESP32 . The program code can be used on a board other than ESP32 after changes, including triggering sampling and ADC configuration.
Environmental tests Arduino 1.8.3.
What is your idea of using FFT, did you manage to make practical tests, or maybe you have extensive experience in digital signal processing and want to raise DSP-related topics?
Cool? Ranking DIY


