AC Analysis with PartSim
PartSim is a web-based application that allows you to create and simulate electronic circuits online, without needing software to be installed on your computer. You’ll need only an internet connection and a browser. In this third PartSim series article, we will continue our journey through the possibilities offered by this powerful electronic simulation system.
AC analysis
Alternating current (AC) analysis can be used to observe the behavior of an electrical or electronic circuit by varying the frequency of the input generators. In this way, it is possible to study the frequency responses of the components, especially the inductive and capacitive ones.
Usually, this type of analysis is used for the design of an amplifier or a filter.
Simulations with the tuned circuit
Figure 1 shows a typical tuned circuit, often used in radio receivers. It is created on the PartSim website by dragging electronic components from the appropriate panels onto the diagram. It consists of the following elements:
• Sinusoidal voltage generator V1: its voltage and frequency are not decisive, as it is the simulator that automatically sets these parameters
• Sinusoidal voltage generator V1 — its voltage and frequency are not decisive, as it is the simulator that automatically sets these parameters
• 10-K input resistance R1 — it affects the bandwidth of the circuit and determines the Q factor
• 50-mH inductor L2
• 1-nF capacitor C1
This is a typical tuning circuit, which has the function of receiving a certain radio frequency while eliminating all other frequencies. It is, in fact, a particular type of band-pass filter.
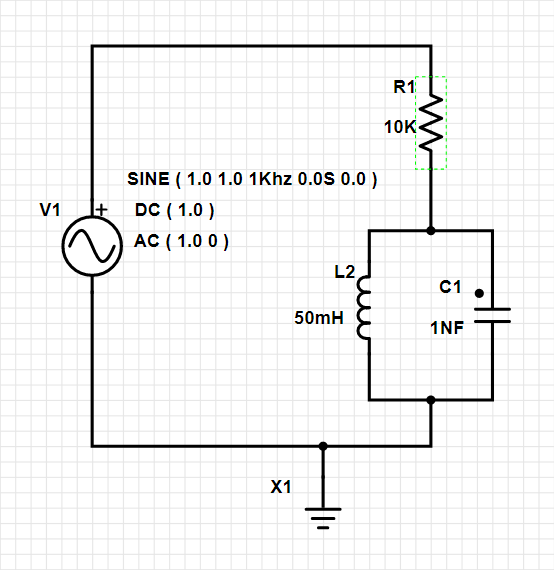
Figure 1: Wiring diagram of the tuned circuit
Resonant frequency
The newly created circuit obviously works in an alternating current regime and behaves differently depending on the frequency of the signal applied to its input. The circuit responds better to a single frequency, that of resonance. In an RLC circuit, the resonant frequency is the frequency at which the reactive components of the impedances (inductive and capacitive reactance) are equal and cancel out. The circuit, in this case, has a purely resistive behavior with minimum modulus and zero phase. To calculate the resonant frequency of a circuit, the following formula is used:

where:
• f is the frequency, expressed in hertz
• L is the inductance value, expressed in henries
• C is the value of the capacitor, expressed in farads
By substituting the component values in the formula, we have:

Resonant frequency
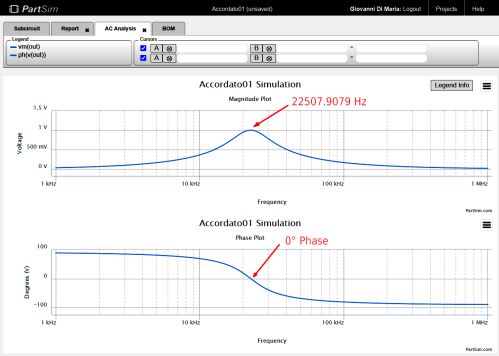
In other words, at the frequency of 22507.9079 Hz, the circuit becomes purely resistive, and the maximum signal is present at its output.
Simulation
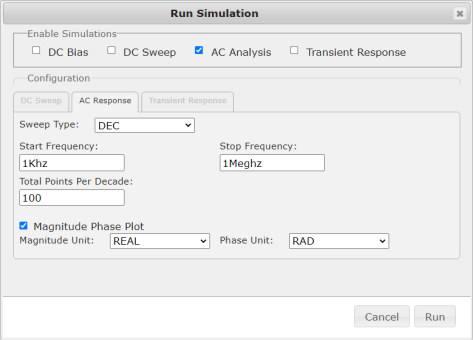
Let’s find out now if the practice confirms the theory by running an AC simulation in PartSim. For this purpose, a “probe” must be set at the output of the circuit, right in correspondence between the resistor and the parallel connection between the capacitor and the inductance. The output signal is picked up at this point. It is also possible to assign a name to this node — for example, “Out” — by simply right-clicking on the relevant connection and selecting the menu item “Set Net Name.” Now press the “Run” button and specify the following data, just as shown in Figure 2:
• “AC Analysis” specifies the type of simulation.
• “DEC” specifies the type of sweep, between “Dec,” “Oct,” and “Lin.”
• “Start frequency” is the lowest starting frequency of the simulation.
• “Stop frequency” is the highest arrival frequency of the simulation.
• “Total Points Per Decade” specifies the number of points used for drawing the graph, for each decade; the more points there are, the more accurate the graph is, with a high resolution.
It is also possible to view or not view the signal phase graph, express the amplitude of the signal in volts or in decibels, and specify the unit of measurement of the phase in degrees or radians.
The AC simulation occurs in the frequency domain, not the time domain. Therefore, on the abscissa axis, the scale is expressed by the frequency in logarithmic format (with the powers of 10 Hz, kHz, MHz, etc.). After pressing the “Run” button, the system displays the simulation results on the screen, in the form of graphs, as shown in Figure 3. We can see two types of graphs:
• The upper graph shows the amplitude of the output signal, in the frequency domain. Its maximum peak occurs at the resonant frequency.
• The lower graph shows the phase trend of the output signal, in relation to the input signal. This aspect is better-explained in the next paragraph.
Phase shift of the signal at different frequencies
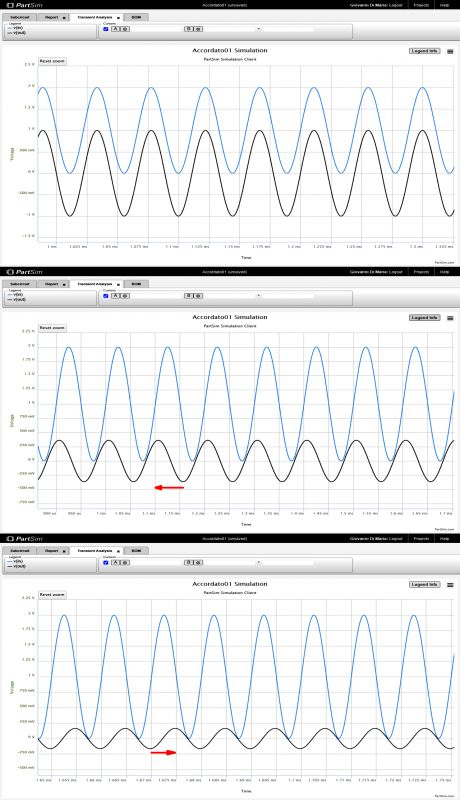
The graphs in Figure 4 clearly show how the phase of the output signal changes with respect to that of the input signal by varying its frequency in the circuit examined. At the resonant frequency, the output signal is perfectly in phase with the input signal and the amplitude is equal to that of the input signal. At a 10-kHz frequency, the output signal is 68.623° out of phase with respect to the input signal and its amplitude is equal to 36.4% with respect to the maximum peak. At a frequency of 100 kHz, the output signal is out of phase by –80.483° with respect to the input one and its amplitude is equal to 15.53% with respect to the maximum peak. For a better understanding of the graphs, a 1-V offset has been applied to the input signal.
The current across resistor R1
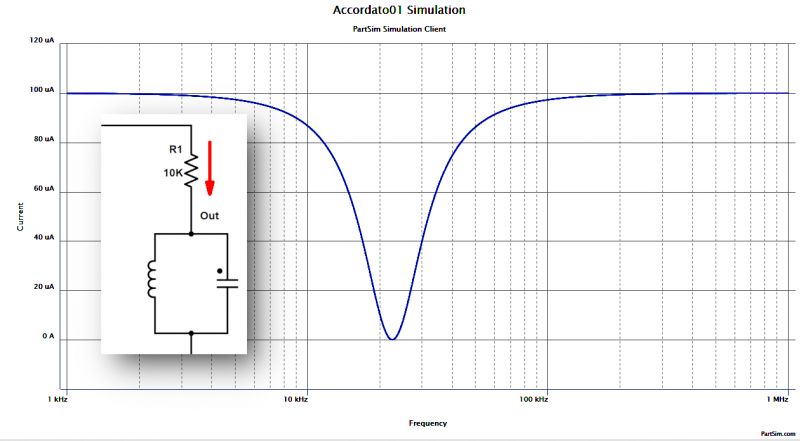
At the resonant frequency (in our case, equal to 22507.9079 Hz), the two reactive components cancel each other out and it is as if they did not exist, so the current that passes through the resistor R1 is zero, as can be seen from the oscillogram in Figure 5. In this electrical state, the voltage at the output is at its maximum.
Conclusion
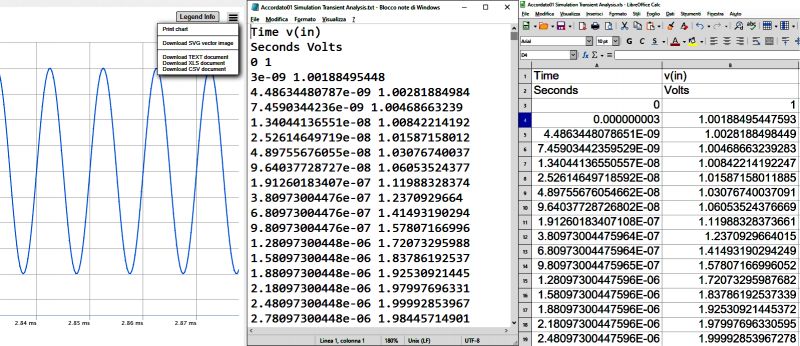
The more you use PartSim, the more you appreciate this electronic simulation environment. The quality and accuracy of its results are at the highest level, thanks to its very powerful and fast SPICE engine. Another peculiarity of PartSim (visible in Figure 6) is that it can export the results in one of the following formats:
• TXT
• XLS
• CSV
For this purpose, simply click on the menu at the top right of the graph and choose the desired format. In this context, it is also possible to export the graphic in SVG vector format, which can be used with the most important graphic software.
PartSim is a web-based application that allows you to create and simulate electronic circuits online, without needing software to be installed on your computer. You’ll need only an internet connection and a browser. In this third PartSim series article, we will continue our journey through the possibilities offered by this powerful electronic simulation system.
AC analysis
Alternating current (AC) analysis can be used to observe the behavior of an electrical or electronic circuit by varying the frequency of the input generators. In this way, it is possible to study the frequency responses of the components, especially the inductive and capacitive ones.
Usually, this type of analysis is used for the design of an amplifier or a filter.
Simulations with the tuned circuit
Figure 1 shows a typical tuned circuit, often used in radio receivers. It is created on the PartSim website by dragging electronic components from the appropriate panels onto the diagram. It consists of the following elements:
• Sinusoidal voltage generator V1: its voltage and frequency are not decisive, as it is the simulator that automatically sets these parameters
• Sinusoidal voltage generator V1 — its voltage and frequency are not decisive, as it is the simulator that automatically sets these parameters
• 10-K input resistance R1 — it affects the bandwidth of the circuit and determines the Q factor
• 50-mH inductor L2
• 1-nF capacitor C1
This is a typical tuning circuit, which has the function of receiving a certain radio frequency while eliminating all other frequencies. It is, in fact, a particular type of band-pass filter.

Figure 1: Wiring diagram of the tuned circuit
Resonant frequency
The newly created circuit obviously works in an alternating current regime and behaves differently depending on the frequency of the signal applied to its input. The circuit responds better to a single frequency, that of resonance. In an RLC circuit, the resonant frequency is the frequency at which the reactive components of the impedances (inductive and capacitive reactance) are equal and cancel out. The circuit, in this case, has a purely resistive behavior with minimum modulus and zero phase. To calculate the resonant frequency of a circuit, the following formula is used:

where:
• f is the frequency, expressed in hertz
• L is the inductance value, expressed in henries
• C is the value of the capacitor, expressed in farads
By substituting the component values in the formula, we have:

Resonant frequency
In other words, at the frequency of 22507.9079 Hz, the circuit becomes purely resistive, and the maximum signal is present at its output.
Simulation
Let’s find out now if the practice confirms the theory by running an AC simulation in PartSim. For this purpose, a “probe” must be set at the output of the circuit, right in correspondence between the resistor and the parallel connection between the capacitor and the inductance. The output signal is picked up at this point. It is also possible to assign a name to this node — for example, “Out” — by simply right-clicking on the relevant connection and selecting the menu item “Set Net Name.” Now press the “Run” button and specify the following data, just as shown in Figure 2:
• “AC Analysis” specifies the type of simulation.
• “DEC” specifies the type of sweep, between “Dec,” “Oct,” and “Lin.”
• “Start frequency” is the lowest starting frequency of the simulation.
• “Stop frequency” is the highest arrival frequency of the simulation.
• “Total Points Per Decade” specifies the number of points used for drawing the graph, for each decade; the more points there are, the more accurate the graph is, with a high resolution.
It is also possible to view or not view the signal phase graph, express the amplitude of the signal in volts or in decibels, and specify the unit of measurement of the phase in degrees or radians.
The AC simulation occurs in the frequency domain, not the time domain. Therefore, on the abscissa axis, the scale is expressed by the frequency in logarithmic format (with the powers of 10 Hz, kHz, MHz, etc.). After pressing the “Run” button, the system displays the simulation results on the screen, in the form of graphs, as shown in Figure 3. We can see two types of graphs:
• The upper graph shows the amplitude of the output signal, in the frequency domain. Its maximum peak occurs at the resonant frequency.
• The lower graph shows the phase trend of the output signal, in relation to the input signal. This aspect is better-explained in the next paragraph.
Phase shift of the signal at different frequencies
The graphs in Figure 4 clearly show how the phase of the output signal changes with respect to that of the input signal by varying its frequency in the circuit examined. At the resonant frequency, the output signal is perfectly in phase with the input signal and the amplitude is equal to that of the input signal. At a 10-kHz frequency, the output signal is 68.623° out of phase with respect to the input signal and its amplitude is equal to 36.4% with respect to the maximum peak. At a frequency of 100 kHz, the output signal is out of phase by –80.483° with respect to the input one and its amplitude is equal to 15.53% with respect to the maximum peak. For a better understanding of the graphs, a 1-V offset has been applied to the input signal.
The current across resistor R1
At the resonant frequency (in our case, equal to 22507.9079 Hz), the two reactive components cancel each other out and it is as if they did not exist, so the current that passes through the resistor R1 is zero, as can be seen from the oscillogram in Figure 5. In this electrical state, the voltage at the output is at its maximum.
Conclusion
The more you use PartSim, the more you appreciate this electronic simulation environment. The quality and accuracy of its results are at the highest level, thanks to its very powerful and fast SPICE engine. Another peculiarity of PartSim (visible in Figure 6) is that it can export the results in one of the following formats:
• TXT
• XLS
• CSV
For this purpose, simply click on the menu at the top right of the graph and choose the desired format. In this context, it is also possible to export the graphic in SVG vector format, which can be used with the most important graphic software.
Cool? Ranking DIY


