







Hello!
I recently decided to undertake at least a part of something called a smart home. In a nutshell : a sensor on bluetooth that sends data to the raspberry and the raspberry has to upload it to my website and it visualises it in some way. In relation to this I have a question. Could someone describe what tools I need? I don't actually know yet in what form I will have the data from this sensor on the raspberry as it hasn't arrived yet, for now I am doing a little preparation. The biggest problem seems to be the visualisation of this data (e.g. a graph of the temperature over a day), and of course querying the raspberry web site for it. (It is the www that should insist on refreshing the data on the server?). I don't know how to go about this at all. If anyone has any information, links that could be useful to me I would be very grateful! Greetings!
I recently decided to undertake at least a part of something called a smart home. In a nutshell : a sensor on bluetooth that sends data to the raspberry and the raspberry has to upload it to my website and it visualises it in some way. In relation to this I have a question. Could someone describe what tools I need? I don't actually know yet in what form I will have the data from this sensor on the raspberry as it hasn't arrived yet, for now I am doing a little preparation. The biggest problem seems to be the visualisation of this data (e.g. a graph of the temperature over a day), and of course querying the raspberry web site for it. (It is the www that should insist on refreshing the data on the server?). I don't know how to go about this at all. If anyone has any information, links that could be useful to me I would be very grateful! Greetings!
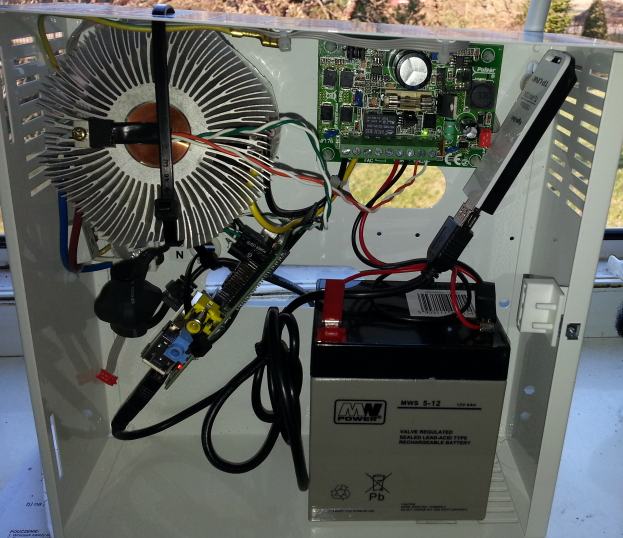
 ), and now I would like the website to update at intervals (set up top-down, basically such as every how many measurements will be done) this file from the raspberry( this graph created from gnuplot). Is it possible to manage this without knowing php and java~ ? If I need to, I'll probably learn but I'd prefer a less complicated solution, I've set up my website on prv.pl if that makes any difference. Regards
