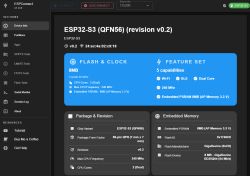
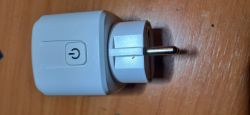
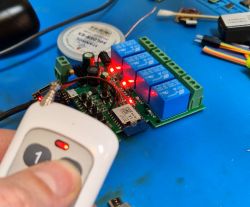
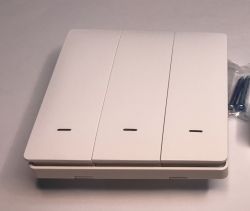
After flashing Openbeken normally I want to quickly see if all is working.
And to be honest I am lazy and just dump all vars to test.mosquitto.org MQTT broker, and use the excellent https://mqtt-explorer.com/ to see if data gets out correctly.
Now I had the problem that someone said hey I want a a powermeter with dashboard as well.
So first I thought ok ill use "startDriver Charts" , but there you go, that is not in the default binary.
So why not subscribe to the mqtt topic and stream that to uPlot to use that as dashboard?
Of course this has limitations (like persistence), but at least i dont need to care about setting up some server/logging etc.
So here is a simple JS/HTML that subscribes to a topic on a broker, and streams it as datastream to uPlot ( https://github.com/leeoniya/uPlot )

I took some random mqtt topic that publishes temperature My_Home_1/Temp/temperature3
Just save the file below as HTML and run it. You can try it also in JsFiddle : https://jsfiddle.net/0yazw571/
Added after 38 [minutes]:
>>21619093
Improvements to do : add multipliers in sensorTopics since OpenBeken needs that for raw values sometimes, and "default show/hide" flags, eg you would want frequency of powermeter, but not always visible.
And to be honest I am lazy and just dump all vars to test.mosquitto.org MQTT broker, and use the excellent https://mqtt-explorer.com/ to see if data gets out correctly.
Now I had the problem that someone said hey I want a a powermeter with dashboard as well.
So first I thought ok ill use "startDriver Charts" , but there you go, that is not in the default binary.
So why not subscribe to the mqtt topic and stream that to uPlot to use that as dashboard?
Of course this has limitations (like persistence), but at least i dont need to care about setting up some server/logging etc.
So here is a simple JS/HTML that subscribes to a topic on a broker, and streams it as datastream to uPlot ( https://github.com/leeoniya/uPlot )

I took some random mqtt topic that publishes temperature My_Home_1/Temp/temperature3
Just save the file below as HTML and run it. You can try it also in JsFiddle : https://jsfiddle.net/0yazw571/
<!DOCTYPE html>
<html lang="en">
<head>
  <meta charset="UTF-8">
  <title>MQTT uPlot</title>
  <link href="https://cdn.jsdelivr.net/npm/uplot@1.6.20/dist/uPlot.min.css" rel="stylesheet">
  <script src="https://cdn.jsdelivr.net/npm/uplot@1.6.20/dist/uPlot.iife.min.js"></script>
  <script src="https://unpkg.com/mqtt/dist/mqtt.min.js"></script>
  <style>
    #chart {
      width: 800px;
      height: 400px;
    }
  </style>
</head>
<body>
  <div id="chart"></div>

  <script>
 function uPlotMQTTPlugin(config) {
      const {
        brokerUrl,
        brokerOptions = {},
        topics,
        maxPoints = 100,
        redrawEvery = 10
      } = config;

      const timeStamps = [];
      const seriesDataArray = [timeStamps];

      topics.forEach(() => seriesDataArray.push([]));

      let uPlotInstance = null;
      let updateCounter = 0;

      const mqttClient = mqtt.connect(brokerUrl, brokerOptions);

      mqttClient.on("connect", () => {
        topics.forEach(({ topic }) => {
          mqttClient.subscribe(topic, err => {
            if (err) console.error("Subscribe failed:", topic, err);
          });
        });
      });

      mqttClient.on("message", (topic, message) => {
        const value = parseFloat(message.toString());
        const currentTime = Date.now() / 1000;

        const topicIndex = topics.findIndex(t => t.topic === topic);
        if (topicIndex === -1) return;

        const isNewTime = timeStamps.length === 0 || currentTime - timeStamps[timeStamps.length - 1] >= 0.5;

        if (isNewTime) {
          timeStamps.push(currentTime);
          for (let i = 1; i < seriesDataArray.length; i++) {
            seriesDataArray[i].push(null);
          }
        }

        seriesDataArray[topicIndex + 1][seriesDataArray[0].length - 1] = value;

        if (timeStamps.length > maxPoints) {
          timeStamps.shift();
          for (let i = 1; i < seriesDataArray.length; i++) {
            seriesDataArray[i].shift();
          }
        }

        updateCounter++;
        if (updateCounter % redrawEvery === 0) {
          uPlotInstance.setData(seriesDataArray);
        }
      });

      return {
        hooks: {
          ready: [
            (u) => {
              uPlotInstance = u;
              u.setData(seriesDataArray);
            }
          ]
        }
      };
    }

    // Configuration for broker and topics
    const sensorTopics = [
      { topic: "My_Home_1/Temp/temperature3", name: "Temperature 3 (°C)", color: "red" },
      { topic: "My_Home_1/Temp/temperature2", name: "Temperature 2 (°C)", color: "blue" }
    ];

    const uPlotChart = new uPlot({
      title: "Sensor Data",
      width: 800,
      height: 400,
      series: [
        {}, // timestamp axis
        ...sensorTopics.map(t => ({
          label: t.name,
          stroke: t.color,
          spanGaps: true
        }))
      ],
      axes: [
        {},
        {}
      ],
      plugins: [
        uPlotMQTTPlugin({
          brokerUrl: "wss://test.mosquitto.org:8081",
          brokerOptions: {},
          topics: sensorTopics,
          maxPoints: 100,
          redrawEvery: 10
        })
      ]
    }, [[], ...sensorTopics.map(() => [])], document.getElementById("chart"));
  </script>
</body>
</html>
Added after 38 [minutes]:
>>21619093
Improvements to do : add multipliers in sensorTopics since OpenBeken needs that for raw values sometimes, and "default show/hide" flags, eg you would want frequency of powermeter, but not always visible.


