logo elektroda
logo elektroda
X
logo elektroda

Developing a Charts Driver for OpenBeken to Display Measurement History

p.kaczmarek2 939 25
ADVERTISEMENT
  • #1 21221946
    p.kaczmarek2
    Moderator Smart Home
    It's a great time to get ESP32 support, I've started working recently on a "charts" driver for OBK so we will be able to display some measurements history on the OBK device itself.
    Helpful post? Buy me a coffee.
  • ADVERTISEMENT
  • #2 21221972
    max4elektroda
    Level 20  
    I've seen that approach. It's a coincidence I had the same idea but started with the other side ;-)
    I think one point is how to store a history of values and how many memory can be used. I would propose a storage of temperatures in 8 bits, it should be sufficient to store rounded temperatures in this.

    Personally I think it might be an alternative not to use an external library but make a simple own implementation (I would think of converting the data to an svg image).
    But maybe we should separate this topic...
  • #3 21222004
    p.kaczmarek2
    Moderator Smart Home
    The data can be stored in much more efficient manner but in case of my "charts" driver it was not the design requirement. I've been thinking rather about a flexible method to generate any charts, without worrying that much about space.

    If we were to design a super efficient charts driver, we could have done much more than just using 8 bit type for temperature. For example, if we, let's say, know that we want to store temperature+humidity, we could have used 7 bits for humidity and 9 bits for temperature and use a short type (16 bits), etc, but that would make things too unflexible.

    I've been thinking about some kind of flexible charts API, idk, like a command to setup N series (like: "setup chart with humidity and temperature") and a command to add samples (from script). The charts driver wouldn't have anything hardcoded, it would just display the data from the ring buffer. Optionally, ring buffer could be saved to LittleFS or something.

    For now, I've chosen a float data type (32 bits per sample) because I can't tell in advance what will be stored there, and storing voltage may be different than storing, I don't know, power consumption.

    In theory, we could have allow user to set a type for chart, like "setup a chart with series of bytes and series of floats" and handle it in code (type enumeration?), but that complicates the driver code
    Helpful post? Buy me a coffee.
  • #4 21222012
    max4elektroda
    Level 20  
    I'll try to share my first thoughts and ideas tomorrow.

    Regarding the charts: usually the device showing the OBK gui will have internet access, then it's no problem to download a library for charts.
    On the other Hand, I would usually prefer a gui that is "self containing" and doesn't need to download content from remote.
  • #5 21222026
    p.kaczmarek2
    Moderator Smart Home
    The best thing about the drivers and online build system is that we can actually make multiple drivers with separate goals in mind. An offline lightweight driver and online flexible charts driver.

    Alternatively, we could just try to support fetching this charts lib from LittleFS....
    Helpful post? Buy me a coffee.
  • #6 21222608
    p.kaczmarek2
    Moderator Smart Home
    @divadiow are you able to get any OBK platform device with DHT11 or anything working for some tests?

    https://github.com/openshwprojects/OpenBK7231T_App/blob/main/src/driver/drv_charts.c

    Added after 3 [minutes]:

    This:
    
    
    startDriver charts
    // chart with max 16 samples, 3 variables and two separate vertical axes
    chart_create 16 3 2
    // set variables along with their axes
    chart_setVar 0 "Room T" "axtemp"
    chart_setVar 1 "Outside T" "axtemp"
    chart_setVar 2 "Humidity" "axhum"
    // setup axes
    // axis_index, name, flags, label
    chart_setAxis 0 "axtemp" 0 "Temperature (C)"
    // flags 1 means this axis is on the right
    chart_setAxis 1 "axhum" 1 "Humidity (%)"
    // for demonstration purposes, add some data at fixed times
    // First argument is NTP time value
    chart_add 1725606094 20 15 89
    chart_add 1725616094 22 16 88
    chart_add 1725626094 26 17 91
    chart_add 1725636094 30 14 92
    chart_add 1725646094 28 13 92
    chart_add 1725656094 27 15 91


    gives:
    Chart displaying indoor and outdoor temperature and humidity data from a DHT11 sensor.


    This:
    
    startDriver charts
    // chart with max 16 samples, 3 variables and 3 separate vertical axes
    chart_create 16 3 3
    // set variables along with their axes
    chart_setVar 0 "Voltage" "axvolt"
    chart_setVar 1 "Current" "axcurr"
    chart_setVar 2 "Power" "axpower"
    // setup axes
    // axis_index, name, flags, label
    chart_setAxis 0 "axvolt" 0 "Voltage (V)"
    chart_setAxis 1 "axcurr" 1 "Current (A)"
    chart_setAxis 2 "axpower" 2 "Power (W)"
    chart_add 1725606094 12 0.5 6
    chart_add 1725616094 11.8 0.52 6.14
    chart_add 1725626094 11.5 0.54 6.21
    chart_add 1725636094 11.3 0.55 6.22
    chart_add 1725646094 11.1 0.56 6.22
    chart_add 1725656094 10.9 0.58 6.32
    

    gives:
    Chart displaying data on voltage, current, and power over time.
    Helpful post? Buy me a coffee.
  • ADVERTISEMENT
  • #7 21222626
    divadiow
    Level 34  
    yes. I see your PRs and the releases but startdriver charts doesn't seem to start

    User interface screen displaying information about DHT11 sensor and configuration options. Text editor window with a script in the /autoexec.bat file containing commands for chart drawing.

    Code: Text
    Log in, to see the code
  • #8 21222643
    p.kaczmarek2
    Moderator Smart Home
    You need to enable it for your platform in obk_config.h
    Helpful post? Buy me a coffee.
  • #9 21222664
    divadiow
    Level 34  
    my bad. assumed it was ready to rock.

    neat.
    Temperature and humidity chart from DHT11 sensor at various locations.
  • #10 21222689
    p.kaczmarek2
    Moderator Smart Home
    Try this sample, but you need to manually refresh page for it to refresh measurements, not sure why:
    
    startDriver charts
    startDriver NTP
    //waitFor NTPState 1
    chart_create 16 1 1
    chart_setVar 0 "Number" "ax"
    chart_setAxis 0 "ax" 0 "Number"
    
    
    again:
    // EDIT: fixed
    setChannel 5 $rand*0.001
    chart_addNow $CH5
    delay_s 1
    goto again


    or we can try to use a real DHT and capture measurements over a day, idk, one per 15 minutes?
    Helpful post? Buy me a coffee.
  • ADVERTISEMENT
  • #11 21222820
    divadiow
    Level 34  
    p.kaczmarek2 wrote:
    but you need to manually refresh page for it to refresh measurements, not sure why
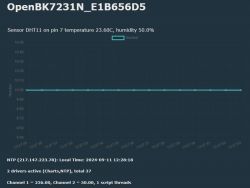
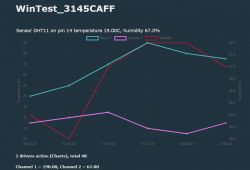
    this in autoexec verbatim gives a single line that does refresh itself but never changes

    Chart from OpenBK7231N app showing a flat line representing an unchanged numerical value.

    p.kaczmarek2 wrote:
    try to use a real DHT and capture measurements over a day, idk, one per 15 minutes
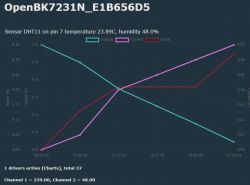

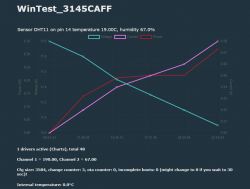
    I can set something up and leave it running yes.

    the second autoexec in post above gives:
    Graph showing changes in voltage, current, and power over time for the device OpenBK7231N_E1B656D5.
  • #12 21222830
    p.kaczmarek2
    Moderator Smart Home
    Auto refresh is annoying, I've added IndexRefreshInterval command.

    For now, for DHT11 setup, I'd suggest:
    
    
    // Sample 8
    // DHT11 setup
    IndexRefreshInterval 100000
    startDriver charts
    startDriver NTP
    waitFor NTPState 1
    chart_create 48 2 2
    // set variables along with their axes
    chart_setVar 0 "Temperature" "axtemp"
    chart_setVar 1 "Humidity" "axhum"
    // setup axes
    // axis_index, name, flags, label
    chart_setAxis 0 "axtemp" 0 "Temperature (C)"
    // flags 1 means this axis is on the right
    chart_setAxis 1 "axhum" 1 "Humidity (%)"
    
    // every 60 seconds, -1 means infinite repeats
    // assumes that $CH1 is temperature div10 and $CH2 is humidity
    addRepeatingEvent 60 -1 chart_addNow $CH1*0.1 $CH2
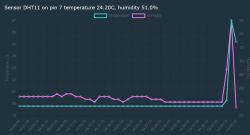
    

    For a start, try with repeating event every 10 seconds or so.


    Take care with number of samples, 48 samples with two variables (and 8 bytes time) it's 48*(4+4+8) = 768bytes
    Helpful post? Buy me a coffee.
  • ADVERTISEMENT
  • #13 21222859
    divadiow
    Level 34  
    >>21222830 1345_merge_b0d7de0b4570

    Graph showing temperature and humidity from DHT11 sensor on pin 7: temperature 23.30°C, humidity 51.0%.

    Added after 3 [minutes]:

    Temperature and humidity chart recorded by DHT11 sensor on pin 7, showing values of 23.30°C and 50.0%.
  • #14 21222948
    p.kaczmarek2
    Moderator Smart Home
    Hmm at first it may look confusing, but after second glance I guess it will look better with some more measurements data?
    Helpful post? Buy me a coffee.
  • #15 21222952
    divadiow
    Level 34  
    >>21222948 Graph showing temperature and humidity from DHT11 sensor on pin 7.

    was going to setup a second with longer intervals. leave it going also
  • #16 21222962
    p.kaczmarek2
    Moderator Smart Home
    Great! By the way, we can also check if my ring buffer implementation works, but I think it should be okay.

    The next question might be how to handle the saving of the data. Whether to use LittleFS or something else. We don't want to waste flash cycles. Maybe we could dedicate few flash sectors and use some kind of logic that allows appending new measurement without an erase cycle, so we could get, I don't know, one erase per 1024 writes (sector is 4096 as far as I remember, and I am assuming we're writing a 4 bytes integer).
    Helpful post? Buy me a coffee.
  • #18 21223149
    p.kaczmarek2
    Moderator Smart Home
    Are you saying that something has broken, or do you have a perfectly stable temperature in your room? We can try larger samples size.
    Helpful post? Buy me a coffee.
  • #19 21223182
    divadiow
    Level 34  
    well. not entirely sure tbh. I don't believe the temperature hasn't changed at all. I'll warm it up a bit

    Added after 3 [minutes]:

    oh no, it's OK. maybe it has stayed constant. held it in my hands for a while and it climbed to 27
    Graph showing temperature and humidity readings from the DHT11 sensor.

    Added after 3 [minutes]:

    im about to harvest another CB3S to sit alongside with the DHT22. want any specific setup for that apart from maybe event every 5 or 10 mins?

    also, if it's every 60s, how come the time reading is every ~2mins?
  • #20 21223280
    p.kaczmarek2
    Moderator Smart Home
    Well, with two variables and time, we get 4+4+8 , which is 16 bytes per sample. My sample BK7231 device has currently.... let me check... free 83024 bytes of RAM. Let's say we want a one day of measurements, and measurements every 15 minutes, so it's 24*4 = 96 samples, somewhat 1.5kB memory. Still not much.
    So, set 96 samples in chart_init and change event time to 15 minutes, which is, 15*60=900 seconds.
    Maybe we can already set it for two days, then it will be 192 samples.

    Regarding the timing issue - I have no idea. It seems we may need to check this. But... no, actually it's not every 2 minutes! Take a closer look:
    Line chart showing measurements every 15 minutes with alternate time labels omitted.
    It's just that every second label is skipped. Probably chart determined that it has not enough space for all of them.
    Helpful post? Buy me a coffee.
  • #21 21223313
    divadiow
    Level 34  
    ah yes :)

    this is running with DHT11 now

    Code: Text
    Log in, to see the code


    DHT22 doesn't seem to work on the pins I've tried on CB3S or WB3S. I get one reading rarely, then nothing. oh well.

    OK in Tasmota
    Screenshot showing temperature and humidity readings from the AM2301 sensor in Tasmota.

    Added after 8 [hours] 25 [minutes]:

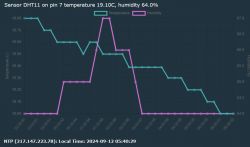
    Graph of temperature and humidity from sensor DHT11 on pin 7, showing temperature 19.10°C and humidity 64.0%.
    and for temp/hum comparison purposes the DHT22 reports similar right now
    Code: Text
    Log in, to see the code
  • #22 21223512
    max4elektroda
    Level 20  
    max4elektroda wrote:
    I'll try to share my first thoughts and ideas tomorrow.
    Sorry, I was busier than expected, first day back from holiday is hard ;-)

    I like the actual possibility,especially because it's open to all sorts of date.

    But still I hope it's ok if I share "my idea", not as far as your working code:

    The actual idea is to keep data to store information as low as possible, that needs to make some hard requirements, which I think are acceptable in many cases.
    - all data is stored periodically with a fixed rate, e.g. every 5 seconds, every minute ...
    - the data is "actual", so we don't need to store timestamps (easily adopted to a slightly "lower constraint", that it's complete (no gaps) and we store the timestamp of the latest data)

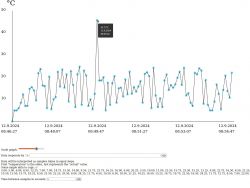
    This way we can build our graph with only data and the knowledge of the timestamp of the latest data point.

    Up to now I'm struggling with a first implementation in OpenBeken, but I can give an idea of how it looks and that it's not so demanding related to memory footprint...

    Graph showing temperature changes over time from 12.09.2024, with temperatures measured every few minutes.

    I attached a simple HTML page for that, so you can try it out yourself - feedback highly appreciated ;-)

    (it's without a separate .js file to have only one file - just remove .txt extension, couldn't upload HTML file)
  • #23 21223774
    max4elektroda
    Level 20  
    Finally some result:
    LN882H is really good in powerSaving, on BK-N I see no difference in temperature (but it's much lower anyway) and no gain of information on W800 ;-)

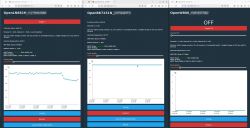
    Screenshots of three interfaces showing data from OpenLN882H, OpenBK7231N, and OpenW800 devices with temperature graphs.

    Added after 5 [hours]:

    p.kaczmarek2 wrote:
    The next question might be how to handle the saving of the data.

    Maybe I can bring up my approach again?
    As soon as you can make sure that samples are taken in fixed rate, you can avoid saving the timestamps. As long as you save the timestamp of the latest data set, you can calculate all other ones from that base.
    This way you can save 4 bytes per sample!

    To minimize memory footprint I also would suggest to decrease the accuracy or the recorded data: Who needs to know that temperature was 21.18° and not 21.25° or even 21° in case of 0.5° steps?
    And can the can you distinguish between this values in the graph, not to bring up the question, if the sensor was correct in measuring this vale?

    So I would suggest to go for more data with less granularity and try to avoid storing information that might be calculated.

    In case you are not using a ring buffer, for environmental data like temperatures it might be even more efficient to store a temperature and the number of equal readings for (at least if you have a limited accuracy) all temperature changes will usually be very slow (as long as you don't use external heating, warm the sensor in your hands or the sun will suddenly reach it). But in general, you will often have similar (equal) readings for longer periods, making it more efficient to store it this way.
    In case you want a ring buffer, this is more challenging, you will need e.g. two bytes per value and "counter", so deleting the oldest entry will have a different impact every time.
    In case of volatile data (as e.g. reading CPU temperature), this won't help ,,

    So with some deep thinking, it should be able to store quite some data in RAM, if we can live with the fact that ist gone in case of a reboot.

    If writing it to flash, only in "large" time ranges to protect the flash memory.
  • #24 21224163
    p.kaczmarek2
    Moderator Smart Home
    Very nice graphs, are they configurable? We can have two charts drivers, so if you just want, we can integrate yours driver as well.

    The size of time_t may be 8 bytes on some platforms, so we may save even more by skipping the time.

    Saving the temperature as 2 bytes instead of 4 bytes may also work, but my driver is designed to be flexible and it would be somewhat a hassle to support multiple data types.
    Still, maybe we could give it a try.
    Introduce a variable types: 8 bit, 16 bit, 32 bit?

    We could also use delta encoding. It may be a bit more tricky with a ring buffer, but it still may be possible. We would need to store one bit (somehow) per variable telling us whether given value is skipped (same as before) or changed. We could also store 2 bits per variable, then 00 means "the same", 01 means "small change" (encoded as one byte), and 10 could mean "full new value".
    Helpful post? Buy me a coffee.
  • #25 21224233
    max4elektroda
    Level 20  
    p.kaczmarek2 wrote:
    Very nice graphs, are they configurable? We can have two charts drivers, so if you just want, we can integrate yours driver as well.

    Kind of, since it's my own implementation, at least extending it for two graphs shouldn't be to much hassle.

    p.kaczmarek2 wrote:
    Saving the temperature as 2 bytes instead of 4 bytes may also work, but my driver is designed to be flexible and it would be somewhat a hassle to support multiple data types.
    Still, maybe we could give it a try.
    Introduce a variable types: 8 bit, 16 bit, 32 bit?

    Sorry that I'm to lazy to look myself ;-): Would it be a possibility/idea to use a union to store data? So we can e.g. use the same type of 32bit to store 1, 2 or 4 values in this entry?


    p.kaczmarek2 wrote:
    We could also use delta encoding. It may be a bit more tricky with a ring buffer, but it still may be possible. We would need to store one bit (somehow) per variable telling us whether given value is skipped (same as before) or changed. We could also store 2 bits per variable, then 00 means "the same", 01 means "small change" (encoded as one byte), and 10 could mean "full new value".


    Yes, that's what I thought, my first idea was (always thinking in 8 bit values ;-)) to us a 16 bit value of two times 8 bit: value first, then up to 255 repetitions of this value. As long as we usually have at least two consecutive equal readings, we wouldn't have overhead.
  • #26 21232406
    max4elektroda
    Level 20  
    max4elektroda wrote:

    I attached a simple HTML page for that, so you can try it out yourself - feedback highly appreciated ;-)

    (it's without a separate .js file to have only one file - just remove .txt extension, couldn't upload HTML file)

    An updated version with some kind of a "library".
    The HTML-File shows, how the library can be used:

    Place a <div> on the HTML page where the graph shall be
    call "createsvg" to initialize a graph (arguments are the div-element, size of the image and an id for the image)

    Then call "draw" to actually visualize the data (the argument is an option element, containing the id of the image created in the step before plus information about the data tor draw...

    Attached is again an HTML file, including a minimized JS version and the "full" JS (still with some testing and commented out lines.
    (again: remove .txt to use ;-), it's just to make the attachments possible)

    But with quite some text to explain the calls ...

Topic summary

The discussion revolves around the development of a "charts" driver for OpenBeken (OBK) to visualize measurement history on devices using the ESP32 platform. Participants explore various design considerations, including data storage efficiency, memory usage, and the flexibility of the charts API. Suggestions include using different data types for temperature and humidity, implementing a ring buffer for data storage, and the potential use of LittleFS for saving data. The conversation also touches on the integration of DHT11 and DHT22 sensors for temperature and humidity readings, with participants sharing code snippets for setting up the charts and addressing issues related to data refresh rates and sample sizes. The importance of minimizing memory footprint while maintaining data accuracy is emphasized, along with the possibility of using delta encoding for efficient data storage.
Summary generated by the language model.
ADVERTISEMENT