logo elektroda
logo elektroda
X
logo elektroda

OpenBeken Charts Driver - configurable and flexible measurement history on your device

p.kaczmarek2 4656 65
ADVERTISEMENT
  • Temperature and humidity chart from DHT11 sensor
    OpenBeken now features a scriptable charts driver that allows you to display an arbitrary number of variables with an arbitrary number of axes. This means you can, for example, show your temperature and humidity history, or a voltage or power, or practically any variable you want. This is done entirely without Home Assistant, everything is handled by OBK device. Here I will show you a basic configuration of such driver and some sample scripts utilizing that.

    This tutorial assumes you have OBK displayed:
    https://github.com/openshwprojects/OpenBK7231T_App
    The following will run on many platforms, including:
    - BK7231T (WB3S, WB2S, WB2L, etc)
    - BK7231N (CB2S, CB2L, WB2L_M1, etc)
    - BK7231M, this is a non-Tuya version of BK7231N with 00000000 keys, also sometimes in BL2028 flavour
    - T34 is based on BK7231N, see flashing trick
    - BL2028N is a Belon version of BK7231N
    - XR809 (XR3, etc)
    - BL602 (SM-028_V1.3 etc), see also BL602 flash OBK via OTA tutorial
    - LF686 (flash it as BL602)
    - W800 (W800-C400, WinnerMicro WiFi & Bluetooth), W801
    - W600 (WinnerMicro chip), W601 (WIS600, ESP-01W, TW-02, TW-03, etc)
    - LN882H by Lightning Semi - datasheet, see flashing how-to, see sample device teardown and flashing, see new flash tool, see dev board
    - Windows, via simulator
    - ESP32 (WIP platform)

    Let's start with checking if your build has "charts" driver:
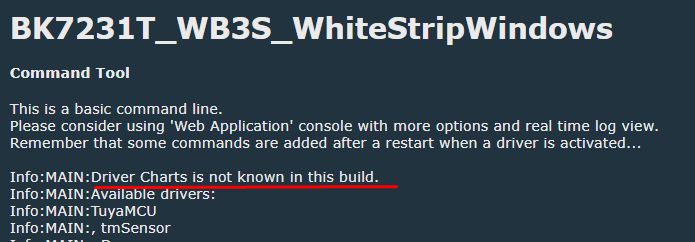
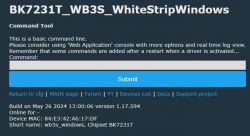
    Screenshot of the BK7231T_WB3S command tool indicating missing charts driver.
    If it's not present, set the ENABLE_DRIVER_CHARTS to 1 in obk_config.h for the platform of your choice by following paragraphs "Per-Pull Request Builds" and "Customizing your own build" in this guide to get your custom build made online (no toolchain required):
    https://www.elektroda.com/rtvforum/topic4033833.html#20946719

    Ok, now I assume that you have "charts" driver in your build.

    So, the charts can be created in autoexec.bat. If you don't know where to create autoexec.bat, see this tutorial:


    Now, once you have basics ready, it's time to check some sample chart scripts!

    First, you need to know the basic steps and then we'll look at sample scripts. So, steps are the following:
    1. start the chart driver
    2. setup the samples count (they are stored in a loop), the number of variables and the number of axes
    3. set the variable names and their respective axes
    4. setup the axes
    5. add data to chart
    It may sound complicated at first but it's very easy, let's check the samples.

    And before I forgot - in the early versions you may also need to add one more command to autoexec.bat - you need to disable page refresh with:
    
    IndexRefreshInterval 100000
    

    This may be fixed soon. The dynamic charts update is not yet ready.

    Sample chart 1 - simplest temperature chart
    This is an example of a basic chart displaying temperature data over time, however, for a demonstration purposes, the data is hardcoded. The chart holds 16 data samples and focuses on a single variable, "Temperature", plotted on one axis.
    
    // Sample 1
    // single variable chart
    startDriver charts
    // chart with max 16 samples, 1 variable and single axis
    chart_create 16 1 1
    // set the temperature variable with axis
    chart_setVar 0 "Temperature" "axtemp"
    // setup axis
    // axis_index, name, flags, label
    chart_setAxis 0 "axtemp" 0 "Temperature (C)"
    // for demonstration purposes, add some data at fixed times
    // First argument is NTP time value
    chart_add 1725606094 20
    chart_add 1725616094 22
    chart_add 1725626094 26
    chart_add 1725636094 30
    chart_add 1725646094 28
    chart_add 1725656094 27
    

    Result:
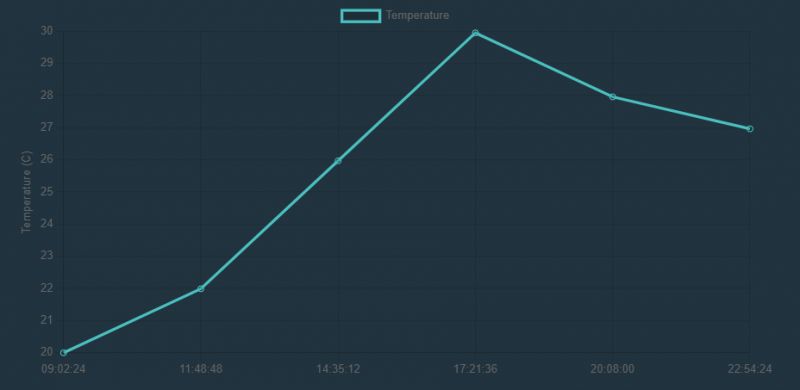
    Line chart showing temperature changes throughout the day.

    Sample chart 2 - multiple variables of single type
    The same approach can be used to display multiple measurements of the same type. Here, for example, we display 3 different temperature values:
    
    // Sample 2
    // Three temperature variables chart
    startDriver charts
    // chart with max 16 samples, 3 variables and single axis
    chart_create 16 3 1
    // set variables along with their axis
    chart_setVar 0 "Kitchen" "axtemp"
    chart_setVar 1 "Outside" "axtemp"
    chart_setVar 2 "Bedroom" "axtemp"
    // setup axis
    // axis_index, name, flags, label
    chart_setAxis 0 "axtemp" 0 "Temperature (C)"
    // for demonstration purposes, add some data at fixed times
    // First argument is NTP time value
    chart_add 1725606094 20 15 22
    chart_add 1725616094 22 16 23
    chart_add 1725626094 26 17 24
    chart_add 1725636094 30 14 25
    chart_add 1725646094 28 13 22
    chart_add 1725656094 27 15 21
    

    Result:
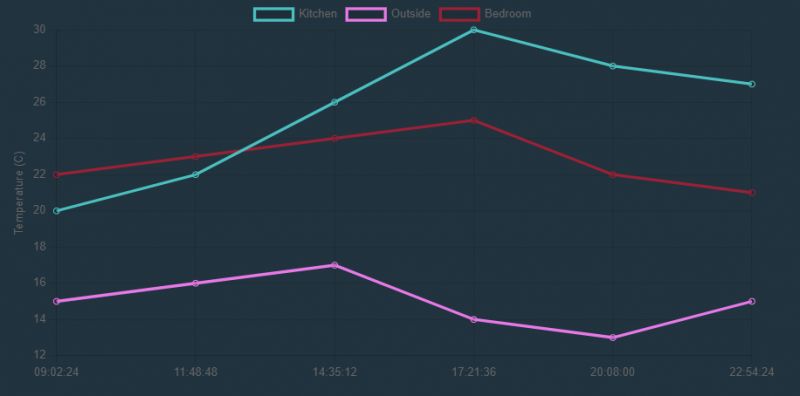
    A chart showing three temperature variables for different locations over time.


    Sample chart 3 - two y axes
    Charts driver can also offer you multiple y axes. This way you can display, for example, both temperature and humidity data:
    
    
    // Sample 3
    // Two temperatures and one humidity with separate Temperature/Humidity axes
    
    startDriver charts
    // chart with max 16 samples, 3 variables and two separate vertical axes
    chart_create 16 3 2
    // set variables along with their axes
    chart_setVar 0 "Room T" "axtemp"
    chart_setVar 1 "Outside T" "axtemp"
    chart_setVar 2 "Humidity" "axhum"
    // setup axes
    // axis_index, name, flags, label
    chart_setAxis 0 "axtemp" 0 "Temperature (C)"
    // flags 1 means this axis is on the right
    chart_setAxis 1 "axhum" 1 "Humidity (%)"
    // for demonstration purposes, add some data at fixed times
    // First argument is NTP time value
    chart_add 1725606094 20 15 89
    chart_add 1725616094 22 16 88
    chart_add 1725626094 26 17 91
    chart_add 1725636094 30 14 92
    chart_add 1725646094 28 13 92
    chart_add 1725656094 27 15 91
    

    Result:
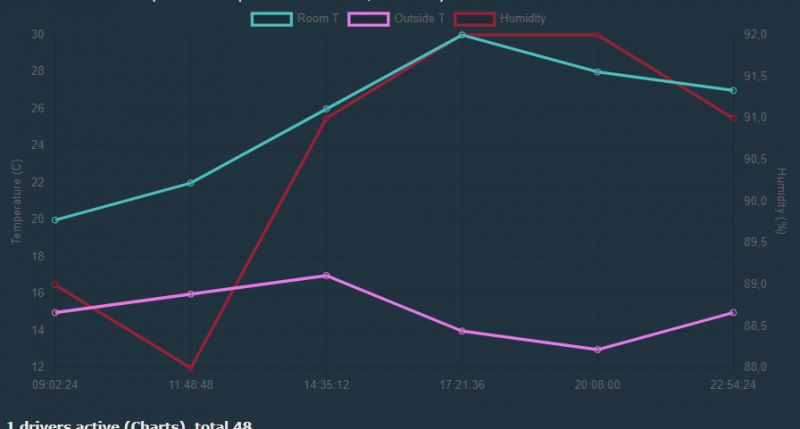
    Chart showing room temperature, outside temperature, and humidity.

    Sample chart 4 - battery and pressure
    Of course, you can display any kind of data you want. Here is for example a voltage and the pressure chart:
    
    // Sample 4
    // Battery voltage + pressure
    startDriver charts
    // chart with max 16 samples, 2 variables and 2 axes
    chart_create 16 2 2
    // set variables along with their axis
    chart_setVar 0 "Battery Voltage" "axvolt"
    chart_setVar 1 "Pressure" "axpress"
    // setup axis
    // axis_index, name, flags, label
    chart_setAxis 0 "axvolt" 0 "Battery Voltage (V)"
    chart_setAxis 1 "axpress" 1 "Pressure (hPa)"
    // for demonstration purposes, add some data at fixed times
    // First argument is NTP time value
    chart_add 1725606094 3.8 1013
    chart_add 1725616094 3.7 1011
    chart_add 1725626094 3.7 1012
    chart_add 1725636094 3.6 1015
    chart_add 1725646094 3.5 1013
    chart_add 1725656094 3.4 1014
    

    Result:
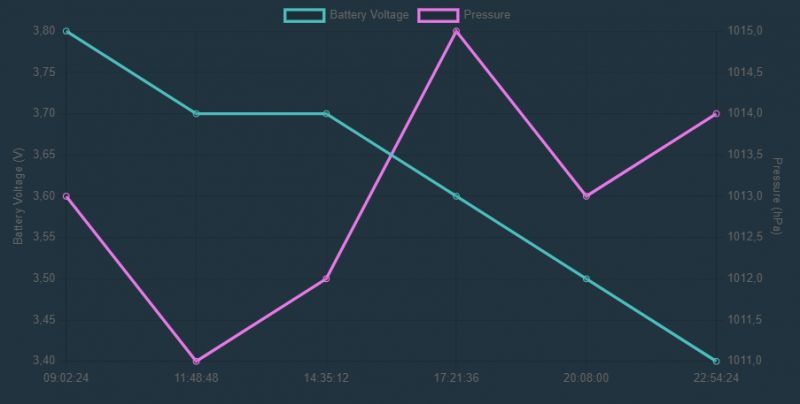
    Graph showing battery voltage and pressure over time


    Sample chart 5 - third y axis
    While not recommended, it's still possible to add a third unit axis. Here is a VCP (Voltage/Current/Power) graph:
    
    
    // Sample 5 - try 3 axes
    startDriver charts
    // chart with max 16 samples, 3 variables and 3 separate vertical axes
    chart_create 16 3 3
    // set variables along with their axes
    chart_setVar 0 "Voltage" "axvolt"
    chart_setVar 1 "Current" "axcurr"
    chart_setVar 2 "Power" "axpower"
    // setup axes
    // axis_index, name, flags, label
    chart_setAxis 0 "axvolt" 0 "Voltage (V)"
    chart_setAxis 1 "axcurr" 1 "Current (A)"
    chart_setAxis 2 "axpower" 2 "Power (W)"
    // for demonstration purposes, add some data at fixed times
    // First argument is NTP time value
    chart_add 1725606094 12 0.5 6
    chart_add 1725616094 11.8 0.52 6.14
    chart_add 1725626094 11.5 0.54 6.21
    chart_add 1725636094 11.3 0.55 6.22
    chart_add 1725646094 11.1 0.56 6.22
    chart_add 1725656094 10.9 0.58 6.32
    

    Result:
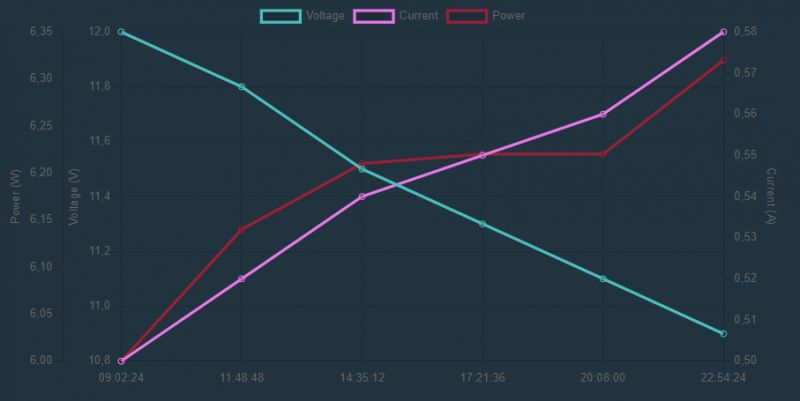
    Chart with three y-axes showing voltage, current, and power.


    Final sample - how to plot DHT11 measurements?
    All samples so far had hardcoded time values, but it's also possible to get time from NTP. For this purpose, first we need to start NTP and wait for NTP connect:
    
    startDriver NTP
    waitFor NTPState 1
    

    Then we can periodically call chart_addNow command, with, for example, given channel content:
    
    // in a loop
    again:
    // This assumes that $CH1 is temperature_div10
    // chart_addNow will take time from the NTP driver
    chart_addNow $CH1*0.1
    // every 10 seconds
    delay_s 10
    goto again
    

    Alternatively, we can use repeating event for that - it's the same:
    
    // every 10 seconds, -1 means infinite repeats
    addRepeatingEvent 10 -1 chart_addNow $CH1*0.1
    

    And then we can build upon that. Here is a full code for DHT11 demo:
    
    // DHT11 setup
    IndexRefreshInterval 100000
    startDriver charts
    startDriver NTP
    waitFor NTPState 1
    chart_create 48 2 2
    // set variables along with their axes
    chart_setVar 0 "Temperature" "axtemp"
    chart_setVar 1 "Humidity" "axhum"
    // setup axes
    // axis_index, name, flags, label
    chart_setAxis 0 "axtemp" 0 "Temperature (C)"
    // flags 1 means this axis is on the right
    chart_setAxis 1 "axhum" 1 "Humidity (%)"
    
    // every 60 seconds, -1 means infinite repeats
    // assumes that $CH1 is temperature div10 and $CH2 is humidity
    addRepeatingEvent 60 -1 chart_addNow $CH1*0.1 $CH2
    

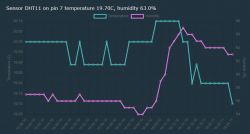
    And here is sample output (from @divadiow , thank you for testing):
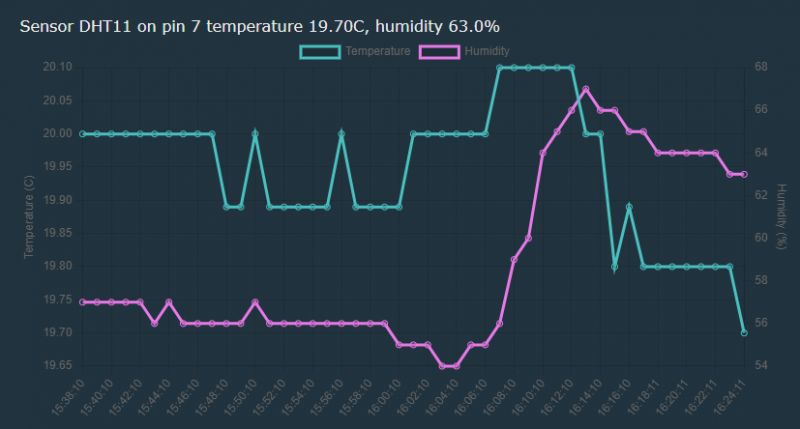
    Temperature and humidity chart from DHT11 sensor
    As you can see, our charts driver can work well with DHT11.


    Remember that you can hover mouse over datapoint
    If you are not sure what is the value of given datapoint, you can always hover mouse about it to get more details:
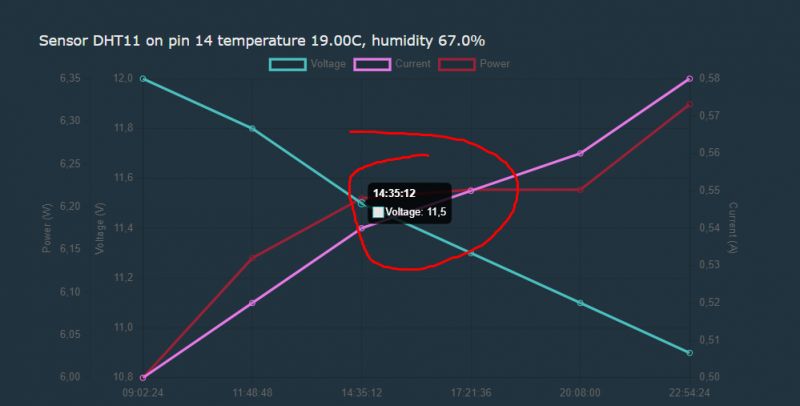
    Chart of variables for DHT11 sensor with voltage, current, and power

    Chart commands
    Summing up, charts have the following commands:
    CommandArgumentsDescription
    chart_createsamplesCount variablesCount axesCountCreates a chart with a specified number of samples, variables, and axes.
    chart_setVarindex varName axisNameAssociates a variable with a specific axis.
    chart_setAxisaxisIndex axisName flags labelSets up an axis with a name, flags, and label. Currently flags can be 0 (left axis) or 1 (right axis)
    chart_addntpTime var1 [var2 ...]Adds data to the chart with specified variables at a specific NTP time.
    chart_addNowvar1 [var2 ...]Adds data to the chart using the current NTP time.

    Of course, they are subject to change in the future, so you may want to check the latest docs here:
    https://github.com/openshwprojects/OpenBK7231T_App/blob/main/docs/commands.md
    https://github.com/openshwprojects/OpenBK7231T_App/blob/main/docs/autoexecExamples.md


    Planned features
    This is a very early version. Some improvements are coming soon:
    - soon it will be possible to specificy RGB color per variable
    - currently OBK is using chart.js library from web, but it is planned to allow users to specify alternative chart.js path so they can fetch it from their own server
    - persistent data storage (optimized to reduce flash wear) is also planned
    You can also give your own feature suggestions and we will do our best to implement them!

    Summing up
    I think that having charts handled directly on device can be very useful, especially for people who do not want to set up their own Home Assistant instance. With our charts driver, you can have just a single IoT device in your house and still enjoy charts data. No Home Assistant, no external server, nothing else is needed! I hope some of you will find this little feature useful. Stay tuned, more updates coming soon.

    Cool? Ranking DIY
    Helpful post? Buy me a coffee.
    About Author
    p.kaczmarek2
    Moderator Smart Home
    Offline 
    p.kaczmarek2 wrote 11958 posts with rating 9994, helped 572 times. Been with us since 2014 year.
  • ADVERTISEMENT
  • #3 21224054
    p.kaczmarek2
    Moderator Smart Home
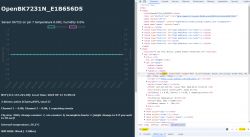
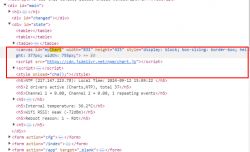
    The div called "state" should contain canvas and script elements which I marked on your Beken device screenshot:
    Screenshot showing an HTML element with a chart canvas and script.
    The following elements are generated DRV_Charts_AddToHtmlPage in drv_charts.c:
    https://github.com/openshwprojects/OpenBK7231T_App/blob/main/src/driver/drv_charts.c
    Those elements are generated if two conditions are met:
    - charts driver must be running, so DRV_Charts_AddToHtmlPage is called
    - a chart (g_chart global variable) must be present
    So, either DRV_Charts_AddToHtmlPage is not called in ESP32 fork or g_chart is not created.

    I can also see on your screenshot that the DRV_AppendInformationToHTTPIndexPage is most likely called for drivers, because I can see driver-specific fields in state div.

    So maybe somehow chart_create was not called for you? Maybe autoexec.bat is not run or suffers whitespace issues?
    Try calling :
    
    chart_create 48 2 2
    

    directly in OBK command line, and not in the autoexec.bat, does anything changes?
    Screenshot of the Command Tool interface for BK7231T_WB3S_WhiteStripWindows.
    If not, then maybe malloc fails? What does the periodic log says in the web app, how much memory is left free? For me, on my test BK7231, there is abut 60kB free at the moment.
    Screenshot of an application log showing free memory and channel changes.
    Helpful post? Buy me a coffee.
  • #4 21224291
    divadiow
    Level 34  
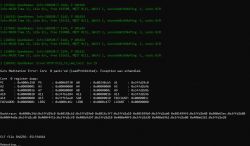
    free space seems OK. If you run that command on its own on command line you get a panic and reboot

    Screen showing OpenBeken system error messages, including core 0 panic and register dump details.

    Added after 7 [minutes]:

    if you scale the autoexec back a bit to

    Code: Text
    Log in, to see the code


    chart_create 48 2 2 still creates a panic

    Added after 6 [minutes]:

    this in logs at crash time

    Screenshot showing a search for corrupt he with results indicating heap memory errors.

    Code: Text
    Log in, to see the code


    Added after 11 [minutes]:

    p.kaczmarek2 wrote:
    Maybe autoexec.bat is not run or suffers whitespace issues?

    I dont think this is the issue. I've sanitized text and can see drivers starting
    Screenshot showing search results for the term charts in a text editor.
  • ADVERTISEMENT
  • #5 21224676
    insmod
    Level 24  
    >>21224291 chart_create 48 2 2 still panics, but you shouldn't use chart_setVar and chart_setAxis before chart_create. They don't have a null check, and so when they try to write, it will crash.
    It can be seen at EXCVADDR on the screenshot.
    Quote:
    The address which has been written/read is found in the EXCVADDR register in the register dump. If this address is zero, it usually means that the application has attempted to dereference a NULL pointer. If this address is close to zero, it usually means that the application has attempted to access a member of a structure, but the pointer to the structure is NULL.
  • #6 21224687
    p.kaczmarek2
    Moderator Smart Home
    I see, two of the functions were missing NULL checks, I've added them now in new commit. The only question is why chart_create panics?
    I've tried to check code with:
    Code: C / C++
    Log in, to see the code

    on Windows but it seems ok.
    Helpful post? Buy me a coffee.
  • #7 21224708
    insmod
    Level 24  
    >>21224687 Done a little testing, using charts_create 10 1 1
    If called a second time, without setvar/setaxis, it tries to free a null pointer
    
    I (174333) OpenBeken: s is not null
    I (174333) OpenBeken: s->axes is not null
    I (174333) OpenBeken: freeing s->axes[0].label
    CORRUPT HEAP: multi_heap.c:61 detected at 0x40828a64
    
  • #8 21224716
    p.kaczmarek2
    Moderator Smart Home
    I see, my testing didn't cover this specific situation, but now I can reproduce it:
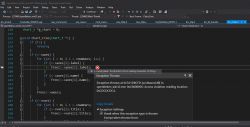
    Screenshot of Microsoft Visual Studio with C code marked with an error related to reading characters from a pointer variable.
    Let me check...

    Added after 2 [minutes]:

    0xcdcdcdcd indicates that I forgot to ZeroMemory the allocated block and in release it would contain random garbage.

    insmod wrote:

    If called a second time, without setvar/setaxis, it tries to free a null pointer

    To be 100% precise, not a NULL pointer, because that was checked, but an unitialized pointer with random value.

    Added after 5 [minutes]:

    Ok, pushed a fix.

    While this fixes repeated chart_create call, it doesn't explain why charts didn't show for @divadiow in the first place?
    Helpful post? Buy me a coffee.
  • #9 21224733
    insmod
    Level 24  
    >>21224716 Right now even chart_create 10 1 1 crashes with Load access fault, with MTVAL register pointing at 0x00000000. But, i have yet to apply latest patch.
  • #10 21224739
    p.kaczmarek2
    Moderator Smart Home
    I am unable to reproduce this issue, however I've tried only on Windows:
    OpenBeken simulation with code and error console.
    I've also pushed a fix for a rare case when malloc fails during chart creation.
    Helpful post? Buy me a coffee.
  • #11 21224741
    insmod
    Level 24  
    With last patch - creates ok, even chart_create 24 2 2, but as soon as i request main http page - it crashes
    with all set
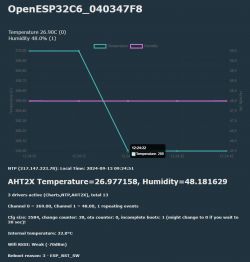
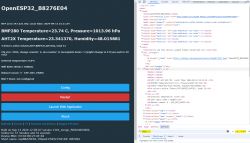
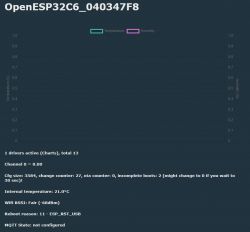
    View of the OpenESP32C6 control panel with temperature and humidity charts.
  • #12 21224744
    p.kaczmarek2
    Moderator Smart Home
    But you didnt' set axes, right?

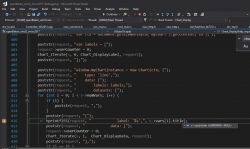
    I guess your platform doesn't like NULL in vsnprintf:
    Screenshot of Visual Studio code editor with highlighted code for chart label.
    On Windows, it's tolerated and does not crash. Okay, let me secure it now.
    Screenshot of a code snippet in an IDE.
    Trust me, being able to run OBK on Windows is a blessing.

    Added after 11 [minutes]:

    Ok added check:
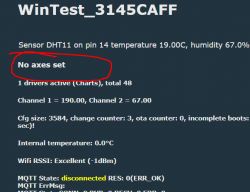
    Screenshot of a system test named WinTest_3145CAFF with an error No axes set highlighted.
    Helpful post? Buy me a coffee.
  • #13 21224797
    insmod
    Level 24  
    >>21224744 Without patch, just preconfigured axes/vars
    Spoiler:
    Chart displaying temperature and humidity data from an OpenESP32C6 unit.

    evaluating $CH0*0.1 isn't working, it just adds to chart as $CH0
    
    IndexRefreshInterval 100000
    startdriver aht2x 0 1 0 1
    startDriver charts
    startDriver NTP
    waitFor NTPState 1
    chart_create 48 2 2
    chart_setVar 0 "Temperature" "axtemp"
    chart_setVar 1 "Humidity" "axhum"
    chart_setAxis 0 "axtemp" 0 "Temperature (C)"
    // flags 1 means this axis is on the right
    chart_setAxis 1 "axhum" 1 "Humidity (%)"
    addRepeatingEvent 10 -1 chart_addNow $CH0*0.1 $CH1
    
  • ADVERTISEMENT
  • #14 21224804
    p.kaczmarek2
    Moderator Smart Home
    The following observation indicates that you may be missing ability to expand variables (or, whatever they are called). Do you have:
    
    #define ENABLE_EXPAND_CONSTANT		1
    

    enabled for your platform?

    If that's your OBK config:
    https://github.com/NonPIayerCharacter/OpenBK7231T_App/blob/_esp_idf/src/obk_config.h
    Then I guess not.
    Helpful post? Buy me a coffee.
  • #15 21225816
    divadiow
    Level 34  
    1344_merge_ff4d8fde47e8
    with
    Spoiler:
    startdriver bmpi2c 22 21 1 2 0
    startDriver aht2x 22 21 3 4
    IndexRefreshInterval 100000
    startDriver charts
    startDriver NTP

    waitFor NTPState 1

    // Create chart with 96 samples, 4 variables, 3 axes (temp, humidity, pressure)
    chart_create 96 4 3

    // Assign variables to chart for BMP280 (CH1 for temp, CH2 for pressure)
    chart_setVar 0 "BMP280_Temperature" "axtemp1"
    chart_setVar 1 "BMP280_Pressure" "axpressure"

    // Assign variables to chart for AHT20 (CH3 for temp, CH4 for humidity)
    chart_setVar 2 "AHT20_Temperature" "axtemp2"
    chart_setVar 3 "AHT20_Humidity" "axhum"

    // Setup axes for temperature, humidity, and pressure
    // BMP280 temperature axis (left)
    chart_setAxis 0 "axtemp1" 0 "Temperature (C) BMP280"
    // AHT20 temperature axis (right)
    chart_setAxis 1 "axtemp2" 1 "Temperature (C) AHT20"
    // Humidity axis for AHT20 (right)
    chart_setAxis 2 "axhum" 1 "Humidity (%) AHT20"
    // Pressure axis for BMP280 (left)
    chart_setAxis 3 "axpressure" 0 "Pressure (hPa) BMP280"

    // Add data to chart every 900 seconds (adjust as needed)
    // Channel mapping: BMP280 -> CH1 (Temp), CH2 (Pressure), AHT20 -> CH3 (Temp), CH4 (Humidity)
    addRepeatingEvent 900 -1 chart_addNow $CH1*0.1 $CH2 $CH3*0.1 $CH4


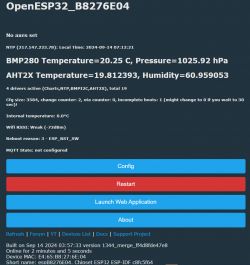
    OpenESP32 user interface with measurement data.

    no crash now when running chart_create 96 4 3 manually. just some junk in log (but there's junk sometimes elsewhere anyway)
    Screenshot of a system log showing a command and result.
  • #16 21232303
    max4elektroda
    Level 20  
    Finally I had some time to check out this driver and I hope it's o.k. to give some feedback or proposals:

    At least for me the chart is never refreshed, to be exact, the graph is refreshed, but only with the data present at time of the last page refresh - tested in Firefox and Chromium.
    I struggled with the same issue with my graph: if a JS variable is changed in the XMLHttpRequest, it seems that if you later use the variable, it still has the original value. Don't know if it is cached, it's not intended to work this way ...
    Do you have the same situation? I "solved" this by separating the values from JS code, putting them into a (hidden) input field and using the input elements value as input to the chart.

    I would suggest to put the JS code for the chart outside the "state" div:
    Now you e.g. load the external chart.js source every time the page status is renewed. If you only put the "data" there and refresh the graph this should work with heavily reduced traffic.

    Furthermore for me it's kind of annoying, that the graph is "animated" - every second the graph is redrawn and the points "move upwards" from the x axes...
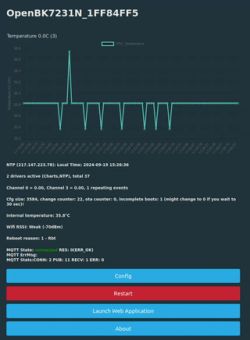
    User interface with CPU chart and buttons in OpenBK7231N application

    For some of the points I made a PR, didn't find the time to change the position of the graph "outside" the state-div yet.
    https://github.com/openshwprojects/OpenBK7231T_App/pull/1352

    If it feels like that I'm complaining, that's totally not the case!
    Please don't get me wrong, I really appreciate your good work and only want to give some hints, how it might be even better (IMHO).
  • ADVERTISEMENT
  • #17 21234841
    max4elektroda
    Level 20  
    Tried to switch to a "separated" code for ring buffer - so it would be possible to use the same code for different cases.
    Up to now, int a 32bit integer - float is "simulated" as an integer multiplied by 100 (so it can hold 2 decimal places and is divided by 100 when reading back).

    Some tests, if it's still working would be great ...

    Its a new PR: https://github.com/openshwprojects/OpenBK7231T_App/pull/1358
  • #18 21234849
    p.kaczmarek2
    Moderator Smart Home
    Thank you, I think I can merge https://github.com/openshwprojects/OpenBK7231T_App/pull/1352 already but I'd need to have charts disabled in obk_config.h by default. I will comment futher when I get some more time.
    Helpful post? Buy me a coffee.
  • #19 21235589
    max4elektroda
    Level 20  
    I just made another change to "move" the chart on the webpage - now it's "below" the "state"-div and will not be replaced on every load of "state".

    In https://github.com/openshwprojects/OpenBK7231T_App/pull/1358, also containing the ringbuffer change.


    Now the graph is "smoothly" animated and not flickering anymore (at least here).
    Image is at 10x speed

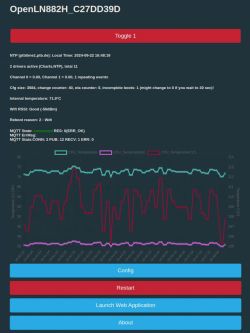
    OpenLN882H application interface displaying CPU temperature graph
  • #20 21235804
    p.kaczmarek2
    Moderator Smart Home
    Very nice, I think I can merge it today or tomorrow. Do I only need to merge this PR or any others as well?

    So the charts library works well with realtime refresh out of the box?
    Helpful post? Buy me a coffee.
  • #21 21235820
    max4elektroda
    Level 20  
    Latest PR also contains changes to ring buffer, not too much tested.
    Will try to separate it the next days, just as a short feedback.
  • #22 21235839
    p.kaczmarek2
    Moderator Smart Home
    Ok, so maybe you can create a selftest_ringBuffer.c and include the buffer itself in the tests?
    Helpful post? Buy me a coffee.
  • #23 21237266
    max4elektroda
    Level 20  
    max4elektroda wrote:
    Will try to separate it the next days, just as a short feedback.

    O.k., made a new #PR1360 for this containing only this two changes:
    - changed the transmitting of data to img elements, so a redraw will use updated data
    - changed the position of the chart below the state - div to avoid flickering

    Some minor changes: renamed the id of the canvas from "myChart" to "obkChart" for a possible "release" version.
    You will probally disable the driver in obk_config, but in order to build the images, I changed it for the devices i own.

    Please note that the charts driver is missing in the SDKs with makfiles which need an entry for every source file (W800, LN882H, are there more ?)

    And: I'm not at home atm, so this PR version is only complied, not yet tested on real HW. Maybe @divadiow is able and willing to giv it a try?

    @p.kaczmarek2 : This makes #1352 obsolete. Can I somehow delete it?
  • #24 21237299
    divadiow
    Level 34  
    I can test whatever later this evening on a few platforms. Maybe @insmod would be kind enough to rerun build on ESP-IDF later when it's merged.
  • #25 21237887
    p.kaczmarek2
    Moderator Smart Home
    Very good job. You can just close older PR when it's not needed.
    Helpful post? Buy me a coffee.
  • #26 21238381
    divadiow
    Level 34  
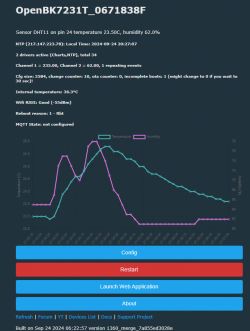
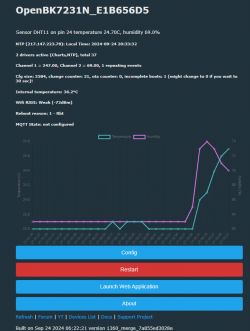
    Screenshot of the OpenBK7231T interface with a temperature and humidity chart. Screenshot of the OpenBK7231N interface with temperature and humidity charts.

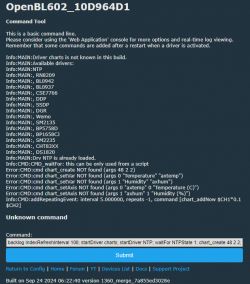
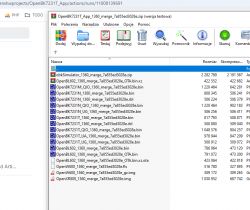
    so hang on, which have Charts driver in that PR?
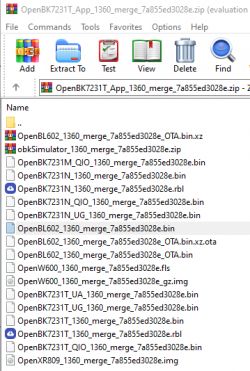
    Screenshot of a file archive displaying the contents of a ZIP file with multiple binary files.

    Screenshot of the OpenBL602_10D964D1 command tool displaying a list of available drivers and errors related to chart commands.
  • #27 21238516
    max4elektroda
    Level 20  
    Good morning,

    thanks for testing. Sorry, I didn't set "#define ENABLE_DRIVER_CHARTS 1" for BL602 in this PR.

    For the brave tester, I will attach the version for BL602 together with the files for platforms needing an additional entry for
    scr/driver/drv_charts.c
    in the Makefiles (W600, W800, LN882H).

    But since the changes are made in HTML / JS part, I would expect it should work on all platforms, if it's working on Beken ones...

    Thanks again!
  • #28 21238560
    p.kaczmarek2
    Moderator Smart Home
    I agree, it should work on all platforms. The only per-platform issue I can think of is the stack size, which may not be the same, as far as I remember.

    @max4elektroda , by the way, did you see Simulator build? It's now available as exe in Releases and you can also test charts there.
    Helpful post? Buy me a coffee.
  • #29 21238660
    max4elektroda
    Level 20  
    p.kaczmarek2 wrote:
    @max4elektroda , by the way, did you see Simulator build? It's now available as exe in Releases and you can also test charts there.


    Yes, thanks a lot.
    BTW: Works on Linux in Wine, too! So a really very usefull enhancement!

    The only thing I can think of to even make it better would be, if the windows build would be built in a PR and then be present in the "Artifacts" of an PR (this way I could have tested even on my business trip ) .
    I know, it's "complaining" at a high level ;-)
  • #30 21239094
    p.kaczmarek2
    Moderator Smart Home
    Wait, it isn't in PR? I was sure that it is... let me check...

    Hmm:
    Screenshot of a file management program showing a list of various files and their details.
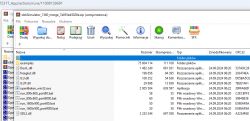
    Screenshot of an archive management program showing the contents of a ZIP file with obkSimulator and several DLL libraries.
    Well, for me it looks like it actually is, but maybe you meant something else? It's simulator Windows build with DLLs and examples pulled from:
    https://github.com/openshwprojects/obkSimulator
    Helpful post? Buy me a coffee.
Topic summary

The discussion revolves around the implementation and troubleshooting of the OpenBeken Charts Driver, which allows users to visualize various data points such as temperature, humidity, voltage, and power on devices without relying on Home Assistant. Users share configurations, scripts, and solutions to issues encountered during setup, including memory management, command execution errors, and chart refresh problems. Key points include the necessity of proper command sequencing, handling of NULL checks, and the importance of enabling specific configurations in the firmware. Feedback on performance and suggestions for improvements, such as avoiding chart flickering during updates, are also discussed.
Summary generated by the language model.
ADVERTISEMENT