The increase in the number of electric cars is transforming manufacturers’ choice of power supply from 12 V to 48 V. Higher voltages offer more power to drive power systems while reducing weight and cost of wiring. All devices in modern automobiles require more electricity, so the traditional 12-V system is no longer sufficient. The substantial reason is that for the same power, in any case, the current must be much higher in 12-V systems.
Ohm’s law also prefers the 48-V power system
Suppose you need to power a starter motor for an automobile. It could possess the following static and dynamic characteristics:
• Supply voltage: 12 V
• Rated current: 40 A
• Rated power: 480 W
• Nominal average impedance: 0.3 Ω
• Inrush current: 150 A
• Inrush power: 1,800 W
• Inrush impedance: 0.08 Ω
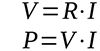
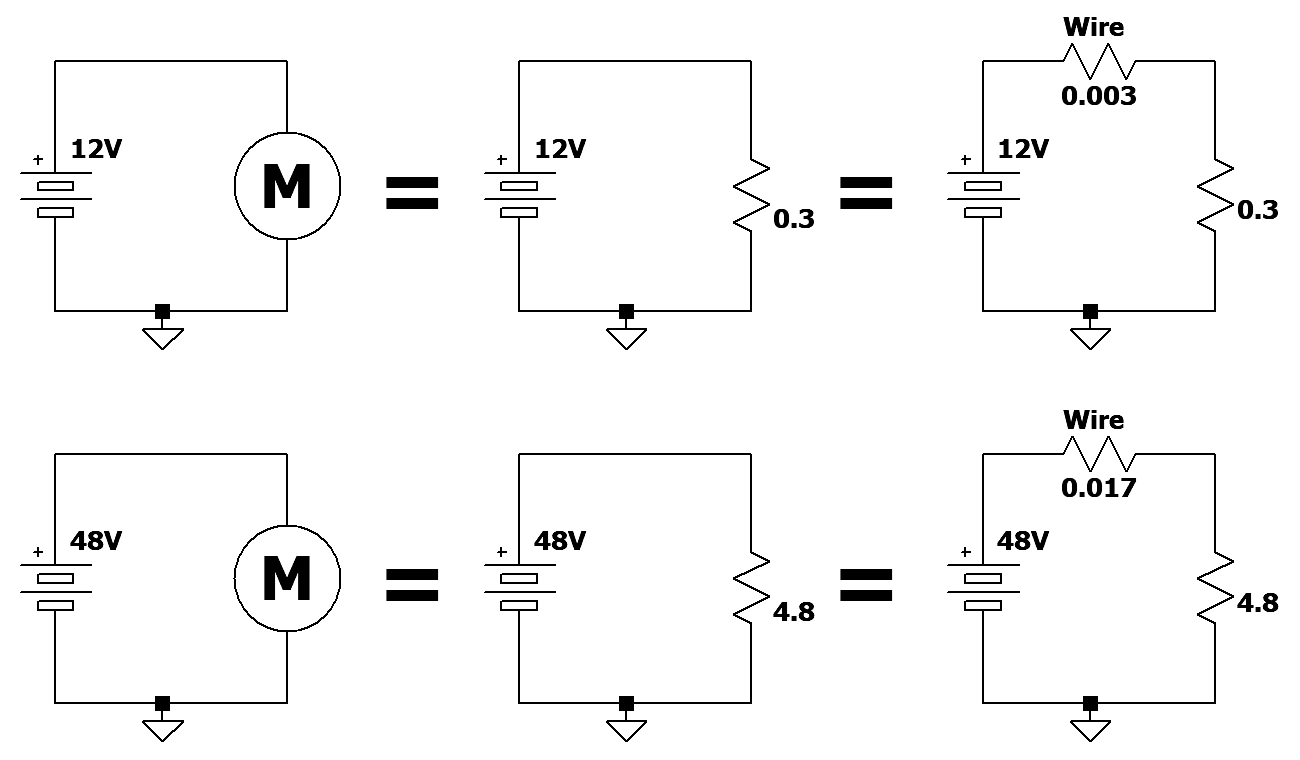
Leaving aside the high inrush current (which, however, affects the thickness of the electrical cables the most), a 12-V battery must supply the current of 40 A to the motor for a few seconds to allow it to rotate with high torque. This is a large load of energy, amounting to several thousand joules, to which the battery and the motor itself are subjected. To allow this amount of current to flow, the electrical cables in the system must be adequate and of a large cross-sectional area to keep them from overheating and avert any danger of fire (see equivalent diagrams in Figure 1). Ohm’s law confirms the calculations above and covers the following main formulas:
The two formulas give rise to other inverse relationships, which make it possible to calculate the resistance as well as the current, having the other known values. Returning to the motor example, a continuous current of 40 A is a fairly large value, which must be handled safely. Starting from the nameplate data of the example motor, the following relationships can be solved:
I = P/V = 480/12=40 A
R = V/I = 12/40=0.3 Ω
The minimum cross-sectional area of a power cable to pass this value of current is 6 mm², but inrush current must also be included, so the minimum recommended cross-sectional area rises to about 35 mm².
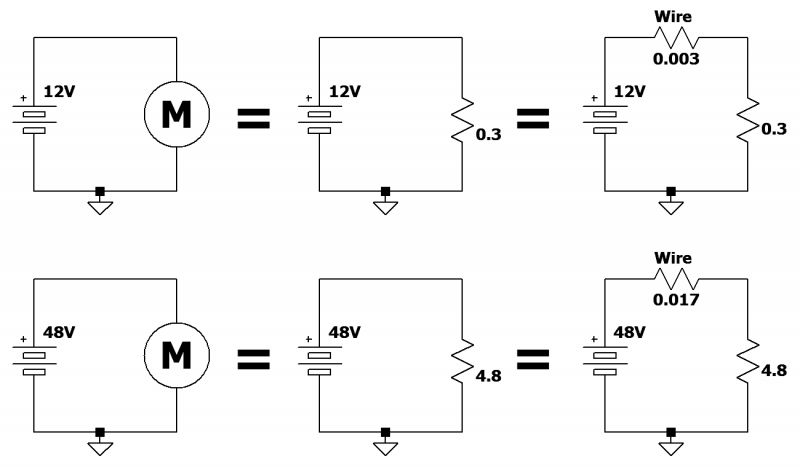 Figure 1: The equivalent wiring diagram of the two power systems
There are special charts that motorists can use together with their trusted electrician. If the power supply were 48 V, the situation would be completely different, as for the same power consumption, the current flowing through the cables would be much lower. The following table shows all the values of the variables involved in the calculation, both with a 12-V and 48-V power supply.
| | 12 V | 48 V |
Rated power | 480 W | 480 W | Rated current | 40 A | 10 A | Average nominal impedance | 0.3 Ω | 4.8 Ω | Recommended section of electrical cable | 6 mm² | 1 mm² | Starting power | 1,800 W | 1,800 W | Inrush current | 150 A | 37.5 A | Inrush impedance | 0.08 Ω | 1.28 Ω | Recommended section of electrical cable | 35 mm² | 3 mm² |
As can be seen from the table, raising the supply voltage from 12 V to 48 V decreases the current flowing through the circuit, and the cables can be safely sized with much smaller diameters. This makes wiring lighter and more affordable.
Simulation of cable temperature
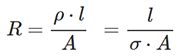
With the data calculated above, it is now possible to simulate the use of different sections of electrical cables to power the above motor with voltages of 12 V and 48 V. The purpose is to find out, for the same power, whether the wiring undergoes a drastic increase in temperature, using the two voltages. For the simulation, only engine operation at steady state (and not at inrush) is considered. The following table shows the characteristics of the copper wire used, 1 meter in length, with resistivity of 1.71 × 10^–8 Ω/meter :
| Material | Length (meter) | Cross-sectional area (mm2) | Resistanceof thecopper wire(Ω) | Powerdissipatedby the wireat 12 V(W) | Powerdissipatedby the wireat 48 V(W) |
Annealed copper | 1 | 1 | 0.0171 | 31.16 | 1.72645 | Annealed copper | 1 | 2 | 0.00855 | 14.58 | 0.859097 | Annealed copper | 1 | 3 | 0.0057 | 9.5 | 0.571038 | Annealed copper | 1 | 4 | 0.004275 | 7 | 0.42852 | Annealed copper | 1 | 5 | 0.00342 | 5.56 | 0.342954 | Annealed copper | 1 | 10 | 0.00171 | 2.77 | 0.170876 | Annealed copper | 1 | 15 | 0.00114 | 1.83 | 0.113956 | Annealed copper | 1 | 20 | 0.000855 | 1.37 | 0.0854721 | Annealed copper | 1 | 25 | 0.000684 | 1.1 | 0.0683878 | Annealed copper | 1 | 30 | 0.00057 | 0.92 | 0.0569848 | Annealed copper | 1 | 35 | 0.00048857142 | 0.78 | 0.0488613 | Annealed copper | 1 | 40 | 0.0004275 | 0.68 | 0.0427589 |
Please note that the resistance value of an electric cable is as follows:
With the powers dissipated by electric cables, at various operating conditions, several F.E.M. simulations can be carried out to calculate, in principle, the temperatures they can reach. When an electric current flows through a conductor, some of the energy is converted into heat by the Joule effect, and the heat generated is dissipated into the surrounding environment. This temperature depends on several factors, such as electrical resistance of the conductor, current, exposed surface area and ambient temperature. The general conditions of thermal simulation F.E.M. are as follows:
• Ambient temperature: 27°C
• Thermal conductivity of copper: 395 mW/(mm/°C)
The following table shows that for the same motor power and cables used, the temperature reached by electrical cables is quite different and sometimes critical.
| Cross-sectionalarea(mm2) | Temperature reachedby the wire at12 V (°C) | Temperature reachedby the wire at48 V (°C) | Resistanceof thecopper wire(Ω) | Powerdissipatedby the wireat 12 V(W) | Powerdissipatedby the wireat 48 V(W) |
1 | 338.6 | 44.26 | 0.0171 | 31.16 | 1.72645 | 2 | 129.8 | 33.06 | 0.00855 | 14.58 | 0.859097 | 3 | 81.78 | 30.29 | 0.0057 | 9.5 | 0.571038 | 4 | 62 | 29.14 | 0.004275 | 7 | 0.42852 | 5 | 51.91 | 28.54 | 0.00342 | 5.56 | 0.342954 | 10 | 35.75 | 27.54 | 0.00171 | 2.77 | 0.170876 | 15 | 31.72 | 27.29 | 0.00114 | 1.83 | 0.113956 | 20 | 30.06 | 27.19 | 0.000855 | 1.37 | 0.0854721 | 25 | 29.2 | 27.14 | 0.000684 | 1.1 | 0.0683878 | 30 | 28.68 | 27.1 | 0.00057 | 0.92 | 0.0569848 | 35 | 28.32 | 27.08 | 0.00048857142 | 0.78 | 0.0488613 | 40 | 28.07 | 27.07 | 0.0004275 | 0.68 | 0.0427589 |
In Figure 2, the thermal gradient of cables crossed by electric current can be observed. The critical cases, with a power supply of 12 V, are represented by the cables with cross-sections of 1 mm², 2 mm², 3 mm² and 4 mm². They reach very high temperatures and pose a danger to the whole circuit. For a 48-V supply, however, there are no particular problems.
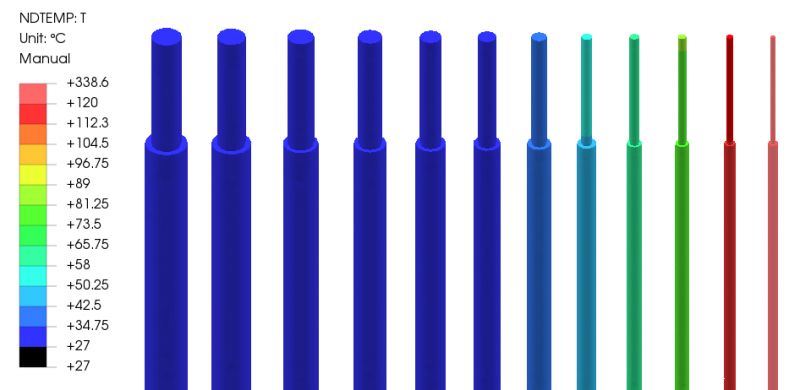 Figure 2: The thermal gradient of cables crossed by the 40-A current with a load drawing 480 W
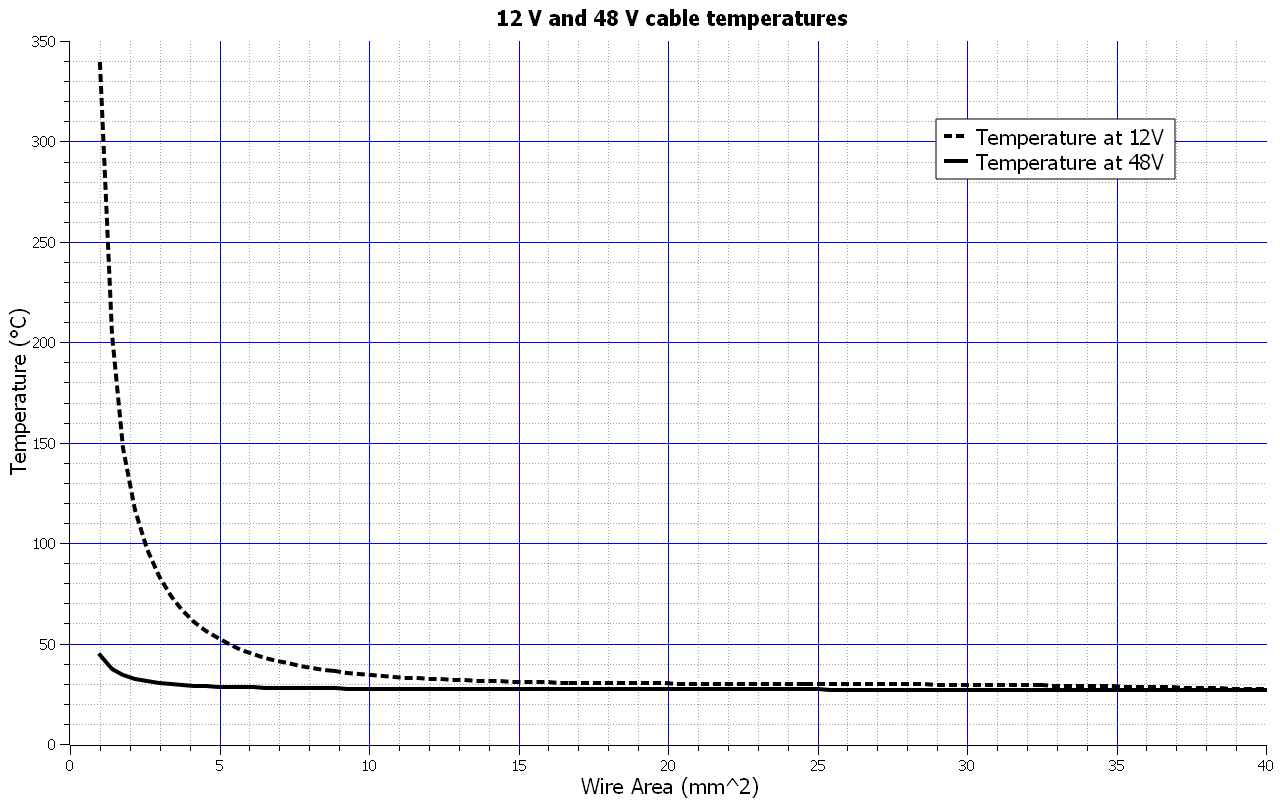
Figure 3 shows the temperature graphs, relative to the above table.
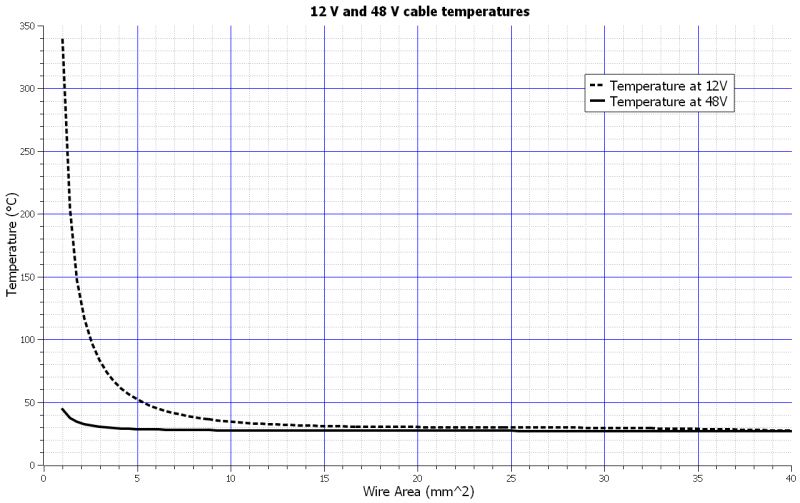 Figure 3: The graph of temperatures reached by the electrical cables, with a voltage of 12 V
Conclusion
The use of a 48-V power supply is becoming increasingly common in modern automobiles. This is because a 48-V electrical system also results in 15% energy savings compared with 12-V systems. Although the design of 48-V systems is more challenging, the electronic components are smaller and lighter, which can lead to improved vehicle performance and efficiency.

Comments