logo elektroda
logo elektroda
X
logo elektroda

How do I group the signals from mySensors on one graph in Domoticz?

Marek_Skalski 1230 3
ADVERTISEMENT
Treść została przetłumaczona polish » english Zobacz oryginalną wersję tematu
  • #1 18884869
    Marek_Skalski
    VIP Meritorious for electroda.pl
    The sensor has 4 sensors whose output signal is a voltage. Each of these sensors is reported as a multimeter generating a voltage signal. They work in mySensors Voltmeter format and are connected to the computer via USB in serial port mode (Nucleo board).
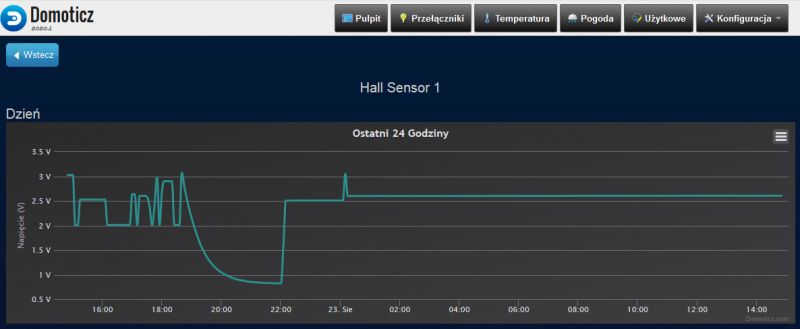
    As each sensor reports as a node, each sensor has a separate graph and this makes it difficult to compare values. Is it possible to group these 4 signals on one graph directly in Domoticz?
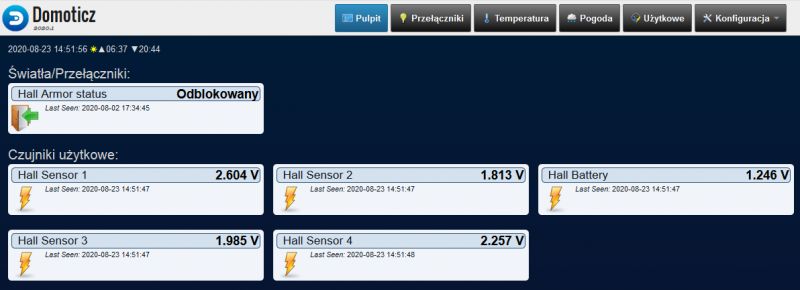
    How do I group the signals from mySensors on one graph in Domoticz? .

    How do I group the signals from mySensors on one graph in Domoticz?

    How do I group the signals from mySensors on one graph in Domoticz? .
  • ADVERTISEMENT
  • Helpful post
    #2 18923908
    xury
    Automation specialist
    Directly in Domoticz unfortunately not.
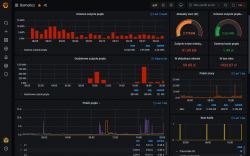
    You can send all the values to Influxdb and display them in one graph in Grafana.
  • ADVERTISEMENT
  • #3 18923970
    Marek_Skalski
    VIP Meritorious for electroda.pl
    Thank you. A bit of an uninteresting option, but good to know it exists.
  • #4 18942657
    xury
    Automation specialist
    I don't know if not very interesting?
    See for yourself:
    How do I group the signals from mySensors on one graph in Domoticz? .
ADVERTISEMENT