Hello
I have connected the energy meter design on the ESP + PZEM from Tasmota and it nicely shows the daily energy consumption, monthly or yearly.
The snag is that on the graph in the monthly consumption I have a solid line something like this:

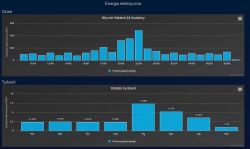
I saw on the web how someone uploaded such a bar graph of the month where he had for each day shown the consumption in bars - something like below (image borrowed from google) :

Question how to make such a graph in domoticz ?
Do you need Grafana for this or can it be set up somehow in Domoticz ?
I have connected the energy meter design on the ESP + PZEM from Tasmota and it nicely shows the daily energy consumption, monthly or yearly.
The snag is that on the graph in the monthly consumption I have a solid line something like this:

I saw on the web how someone uploaded such a bar graph of the month where he had for each day shown the consumption in bars - something like below (image borrowed from google) :

Question how to make such a graph in domoticz ?
Do you need Grafana for this or can it be set up somehow in Domoticz ?


