The following is a Google translation from German to English
Hello community,
I'm making my first attempts at creating charts in Open BK. I've now been able to download a finished file with this option compiled in.
The OTA of this file also worked. And I've also included an example from the example page
(https://www.elektroda.com/rtvforum/topic4075289.html)
in the autoexec.bat.
(
// DHT11 setup IndexRefreshInterval 100000 startDriver charts startDriver NTP waitFor NTPState 1 chart_create 48 2 2 // set variables along with their axes chart_setVar 0 "Temperature" "axtemp" chart_setVar 1 "Humidity" "axhum" // setup axes // axis_index, name, flags, label chart_setAxis 0 "axtemp" 0 "Temperature ( C)" // flags 1 means this axis is on the right chart_setAxis 1 "axhum" 1 "Humidity (%)" // every 60 seconds, -1 means infinite repeats // assumes that $CH1 is temperature div10 and $CH2 is humidity addRepeatingEvent 60 -1 chart_addNow $CH1*0.1 $CH2
)
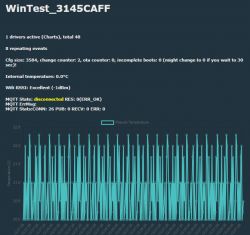
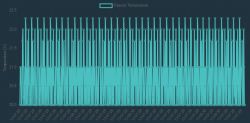
This is also beautifully displayed on the website. I chose the last example (DHT11) where the data is automatically transferred to the graphic every minute via NTP.
I didn't connect a DHT11, but I just wanted to see if it worked with the graphic.
But I have a few questions about the topic.
1a. Can you display the actual time in the graphic? The configured time zone offset is not taken into account.
2a. How high can the first value after Chart_create (for the number of measurement points) be? Is there an upper limit?
3a. Does this script always have to be in the autoexec.bat, or is there another way to start or stop this script during operation? (Without rebooting)
4a. Solved (How do I get energy consumption values included in the Chart_addnow command? )
5a. Where do the variables $CH1 and $CH2 come from in the example? Are they fixed system variables or how did they come about?
I would like to implement 2 different configurations on different devices:
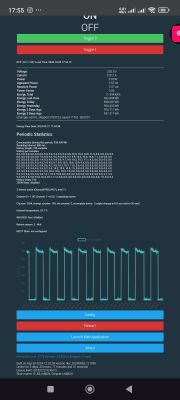
1b. Solved (For example, tapping the current power consumption every 10 seconds, displayed e.g. over the last 60, 120, 180 minutes etc.)
2b. Display of the values reproduced from SetupEnergyStats over 24 hours.
Is what I want to implement clearly formulated and understandable?


