FAQ
TL;DR: Adds a simple SVG temperature graph with 0.5°C steps; binary size +2.3–2.5k. "So for storage we need only 100 bytes for 100 temperatures." Start with startdriver and a 30 s default timestep. [Elektroda, max4elektroda, post #21630393]
Why it matters: It lets you log and visualize chip temperature efficiently without external JS, ideal for constrained IoT devices.
Quick Facts
- 8‑bit encoding spans −15.0°C to +110°C in 0.5°C steps (250 discrete values). [Elektroda, max4elektroda, post #21630393]
- Example storage density: 100 samples fit in 100 bytes (1 byte per reading). [Elektroda, max4elektroda, post #21630393]
- Default sampling interval is 30 seconds; pass an optional timestep at start. [Elektroda, max4elektroda, post #21630393]
- Firmware size increase: W800 +2.5k, W600 +2.3k, BK7231N +2.3k. [Elektroda, max4elektroda, post #21630393]
- Renders a simple SVG graph locally and avoids external JS; small code can live in flash. [Elektroda, max4elektroda, post #21630393]
What is the savetemps driver and what does it do?
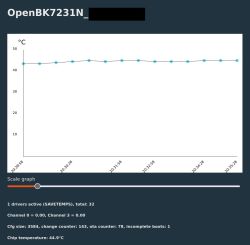
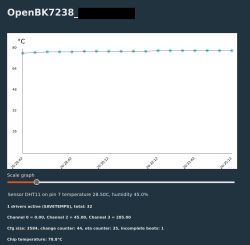
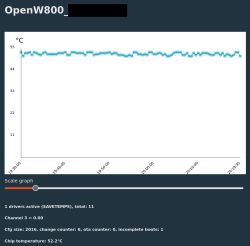
savetemps is a lightweight driver that samples chip temperature and renders a simple on-device SVG graph. It focuses on compact storage by encoding each reading in one byte. It targets OpenBK7231-based builds and similar constrained MCUs. The goal is privacy-friendly visualization without loading third-party JS. The implementation uses a small ring buffer and an equal-timestep assumption to keep metadata minimal. Screenshots in the thread show the SVG output embedded in the device UI. [Elektroda, max4elektroda, post #21630393]
How do I start the driver and set the sampling interval?
Use the console command: startdriver savetemps <optional time between measures, defaults to 30 seconds>. If you omit the argument, it samples every 30 seconds. You can supply a different timestep as needed. How-To:
- Open the device console.
- Run: startdriver savetemps .
- Open the UI to view the SVG temperature graph.
This starts logging and graphing immediately with minimal overhead. [Elektroda, max4elektroda, post #21630393]
What temperature range and resolution are supported?
The encoding covers −15.0°C to +110°C at 0.5°C per step. That mapping consumes 250 of the 255 possible 8‑bit values. This balance gives fine enough resolution for chip thermals while keeping storage compact. It is a practical trade-off for embedded telemetry and quick visualization. The fixed-step design simplifies graph scaling and tool integration. “I decided for a range from −15.0°C to +110°C in 0.5° steps.” [Elektroda, max4elektroda, post #21630393]
How efficient is the storage and how long a history can I keep?
Each reading consumes 1 byte. The author notes: “So for storage we need only 100 bytes for 100 temperatures.” At the default 30‑second interval, that example equals roughly 50 minutes of history for 100 samples. You can scale capacity by adjusting how many readings you store. The ring buffer keeps memory use predictable and small. This approach suits devices with tight RAM or flash budgets. [Elektroda, max4elektroda, post #21630393]
How much firmware size does the feature add on supported chips?
The driver raises image size by approximately 2.5k on W800, 2.3k on W600, and 2.3k on BK7231N. This footprint includes the minimal SVG graphing logic and ring buffer code. The cost is modest compared to bundling larger JS charting libraries. It is sized for Wi‑Fi IoT MCUs where flash is tight. Plan margin accordingly when enabling additional drivers. [Elektroda, max4elektroda, post #21630393]
Does it require internet or external JavaScript to render graphs?
No. It renders a simple SVG directly on the device. The author emphasizes privacy and independence: “not to load JS code from ‘outside’ my network but being able to store a small version in flash.” This keeps the page lightweight and removes external dependencies. It also avoids CORS and CDN outages. It fits well for offline or air‑gapped setups. [Elektroda, max4elektroda, post #21630393]
How are timestamps handled if time isn’t stored with each sample?
The design assumes equal time steps. It uses the actual time as the timestamp of the last sample. Earlier points are placed timestep-by-timestep before that. The author notes this introduces “a small error in the graph.” This is an edge-case trade-off for zero per-sample time metadata. Keep the interval stable for best visual alignment. [Elektroda, max4elektroda, post #21630393]
What happens if temperatures go outside −15°C to +110°C?
Values beyond that window are unsupported by the chosen 8‑bit mapping. The encoding allocates codes for −15.0°C to +110°C in 0.5°C steps only. If your device can exceed this, adjust the mapping or resolution in code. Staying within the defined range ensures correct visualization. This preserves compact storage and keeps parsing simple. [Elektroda, max4elektroda, post #21630393]
Can I reuse the ring buffer code with other drivers?
Yes, the ring buffer lives in a separate file for reuse. The author states: “The simple ringbuffer used is in a separate file, so it might later also be used in graph driver to share the ringbuffer code.” This modularity enables shared data paths and reduces duplication. It simplifies future feature growth across drivers. [Elektroda, max4elektroda, post #21630393]
Which platforms were measured for size impact?
The thread lists size deltas for W800, W600, and BK7231N. These represent typical OpenBK7231-class targets where flash and RAM are constrained. Expect similar overhead on comparable Wi‑Fi MCUs in the project family. Always confirm with your exact toolchain and config. Enable the driver and compare image sizes to plan headroom. [Elektroda, max4elektroda, post #21630393]
Where can I find the code and artifacts?
The author provides a link to the implementation: “Code and artifacts with driver enabled can be found in PR #1346.” Use that PR to review diffs, test assets, and build options. It is the reference for the current driver behavior. Clone the branch and flash to your test board. Validate in your environment before production. [Elektroda, max4elektroda, post #21630393]
What output format is used and how do I display it?
Output is a simple SVG graph generated by the device. You can present it in the device’s web UI or embed it in a page the firmware serves. The screenshots in the thread illustrate the rendered result. The SVG keeps payloads small and renders consistently across browsers. It suits devices without heavy UI frameworks. [Elektroda, max4elektroda, post #21630393]
Can I bundle charts.js in LFS or gzip it if I prefer JS charts?
The author suggests this may be feasible now: “it might now be possible, to put charts.js in lfs, maybe even gziped.” However, the showcased approach avoids that dependency by using SVG. SVG keeps the binary small and privacy focused. If you experiment with JS, measure the image delta. Validate load times and memory pressure. [Elektroda, max4elektroda, post #21630393]


Comments
cool https://obrazki.elektroda.pl/1668972700_1754819589_bigthumb.jpg [Read more]