I. Introduction
During embedded system development, measuring various signal waveforms is a crucial troubleshooting method. Bench oscilloscopes are typically used for waveform analysis, but their large size makes them inconvenient for field testing or travel. For some individual developers, the high cost is also prohibitive—many entry-level bench oscilloscopes still cost hundreds to thousands of dollars, creating a barrier for those with limited budgets. A compact, affordable mini oscilloscope would indeed find its niche, as it can balance portability, cost, and basic measurement needs that align with the daily waveform-checking tasks of embedded developers. Zhengdian Atom likely recognized this market gap and introduced the DS100 Mini
Oscilloscope, a device designed to address the pain points of traditional oscilloscopes in scenarios like on-site debugging of embedded devices or personal project development, where a full-sized oscilloscope is either impractical or too costly.
II. Appearance, Features, and Specifications

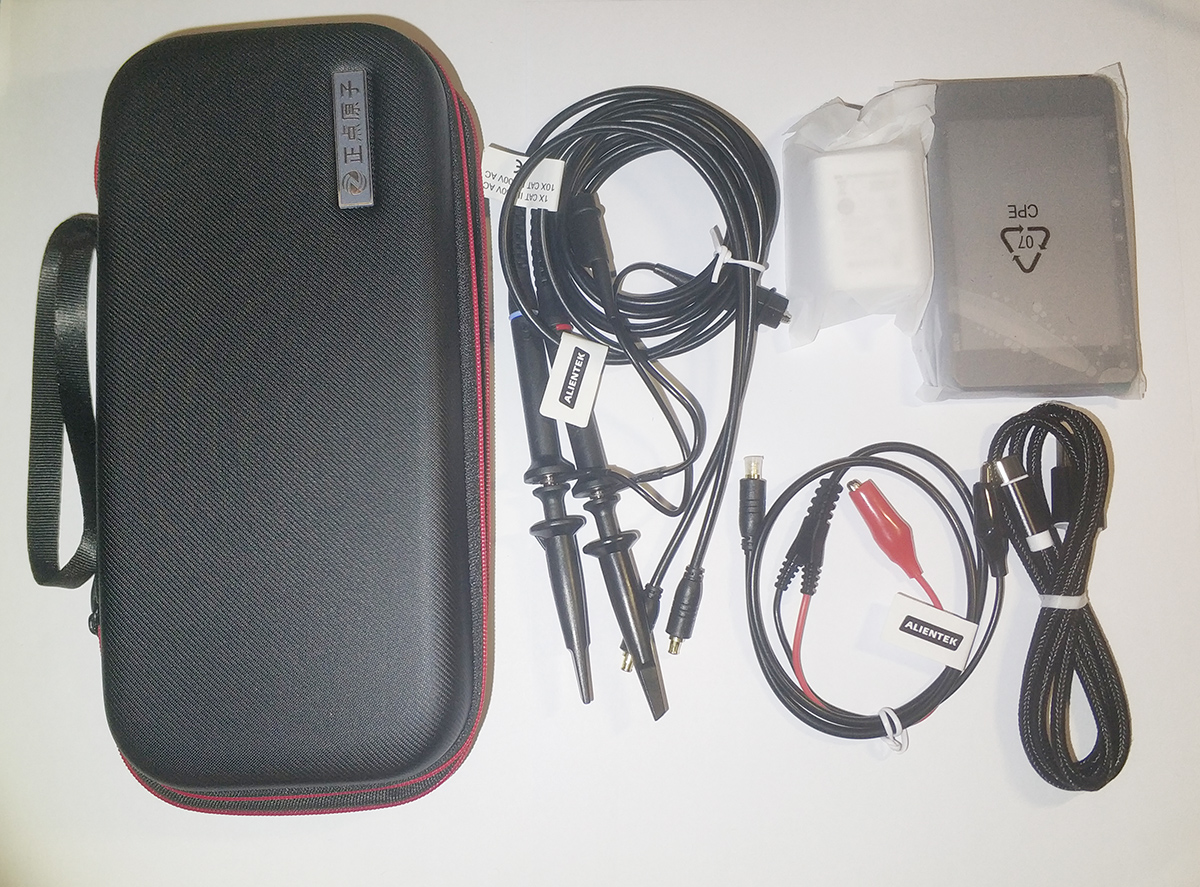
Upon receiving the product, I performed a simple unboxing. It comes in a high-quality hard case that effectively protects the central unit and accessories inside. The package includes two custom probes, a signal output cable, a Type-C data cable, a charging adapter, and finally the DS100 central unit.
Press and hold the P key to power on the central unit. The startup screen displays the Zhengdian Atom logo.
Interfaces and controls include: two analog channels (CHA and CHB), one signal data port, four buttons (P, A, M, E), two scroll wheels (I and II), a charging indicator light, and a Type-C charging/data port.
On the main interface, the largest central area displays waveforms. The top shows primary parameters, the bottom displays measurement results, and the right side houses various parameter settings.
III. Low-Voltage DC Multi-Band Testing
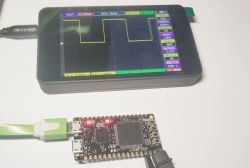
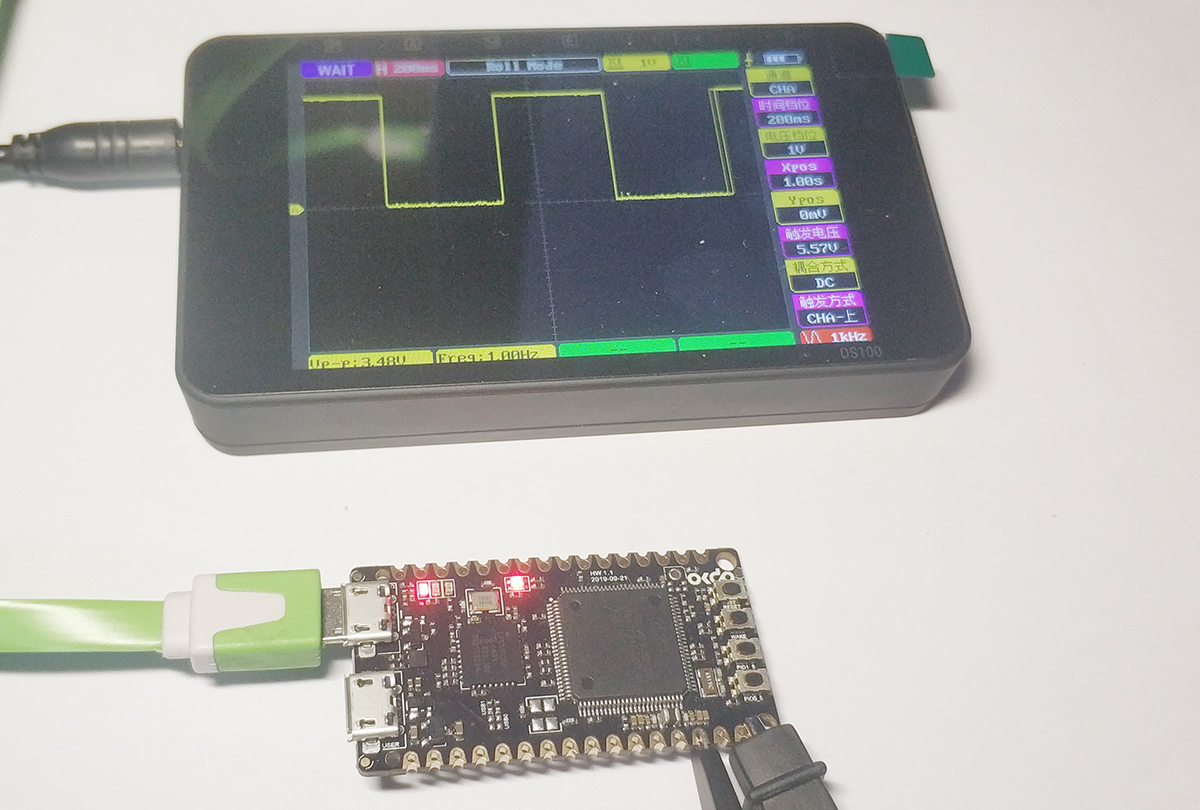
To evaluate the oscilloscope's performance when measuring waveforms at different frequencies, I built a square wave generator using the OKdo E1 development board (MCU: LPC55S69). This generator primarily uses buttons to change the output waveform frequency, enabling square wave outputs at 1Hz, 10Hz, 100Hz, 1kHz, 10kHz, 100kHz, 1MHz, 2MHz, 5MHz, 10MHz, 20MHz, and 50MHz.
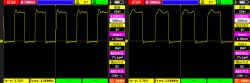
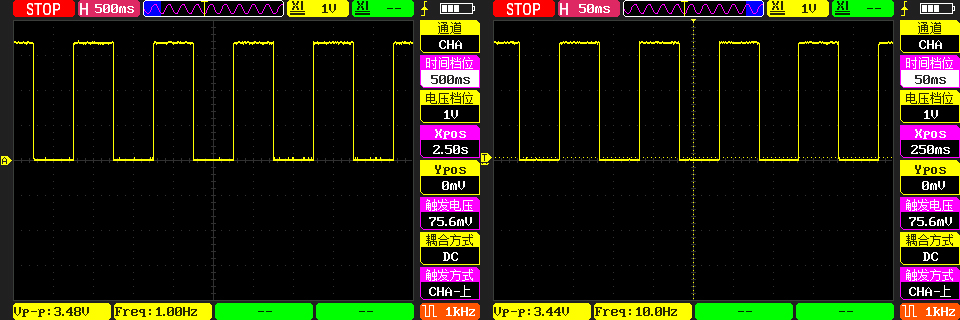
First, I measured the 1Hz and 10Hz waveforms using an oscilloscope, and the waveform quality was excellent.
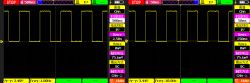
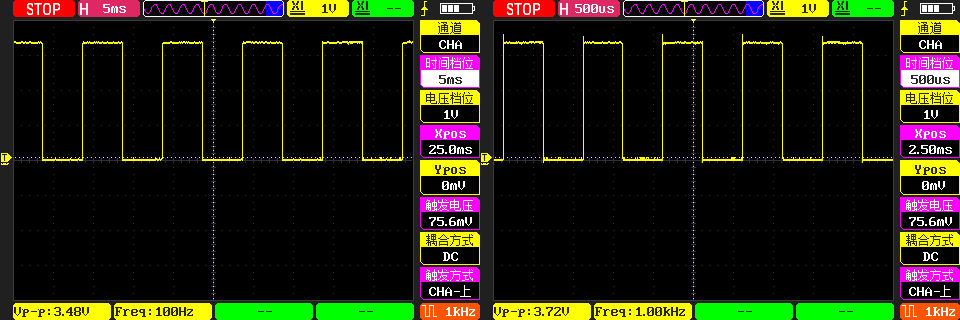
Measurements at 100Hz and 1kHz were also satisfactory, though the 1kHz rising edge exhibited some overshoot.
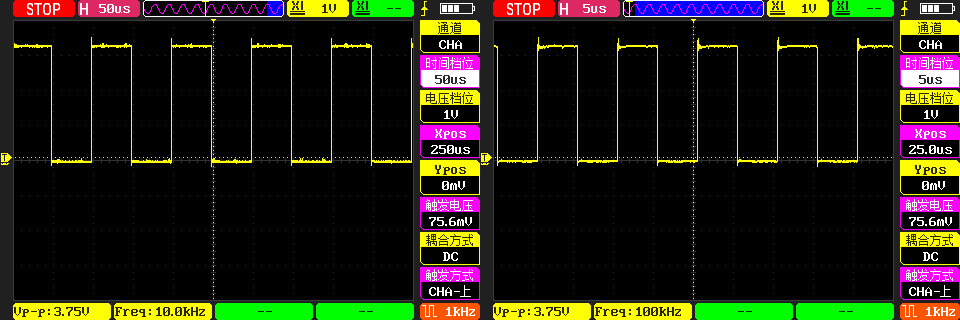
Measurements at 10kHz and 100kHz showed overshoot on the rising edge again, and now the falling edge also exhibited overshoot.
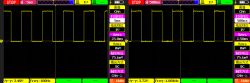
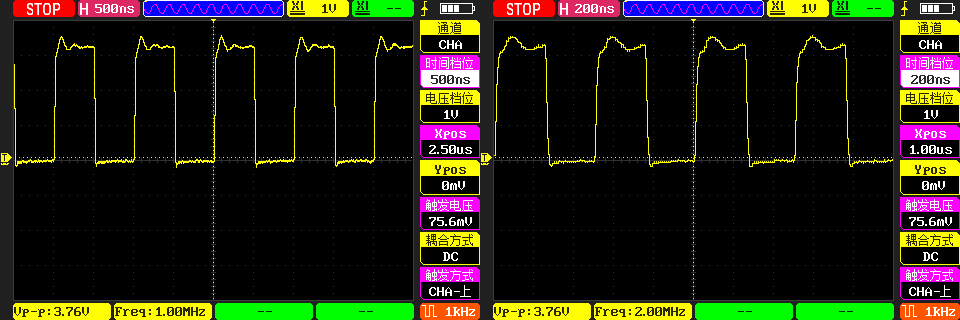
Measured at 1MHz and 2MHz, the square wave plateau is no longer a straight line, but it still clearly retains the square wave shape.
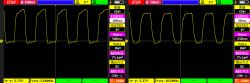
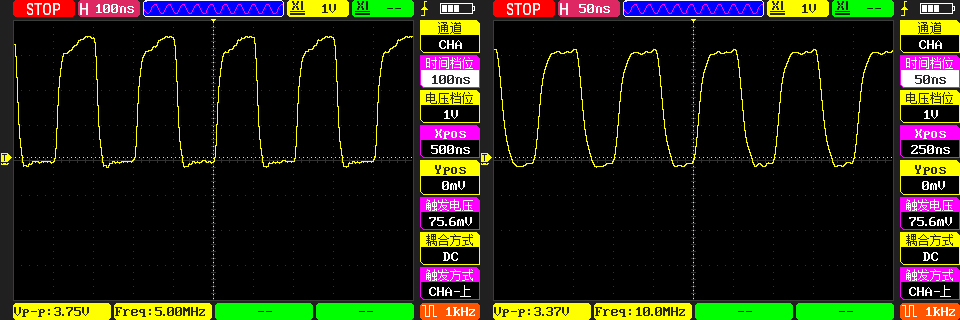
Measurements at 5MHz and 10MHz show the square wave pattern is still visible but has become distorted.
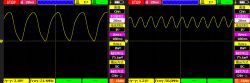
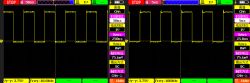
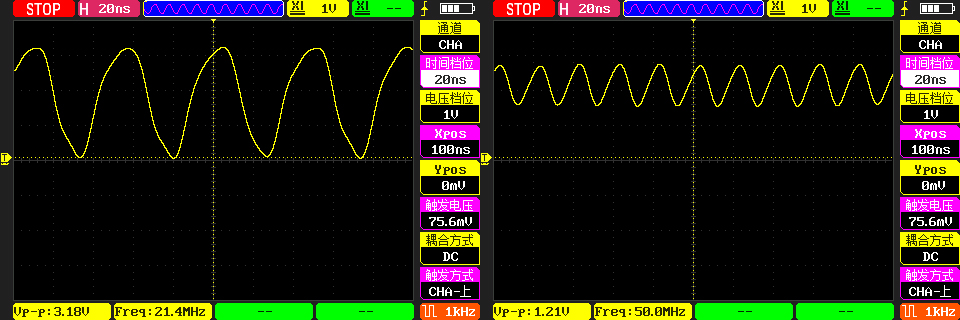
At frequencies of 20MHz and 50MHz, the square wave is no longer visible and has essentially become a sine wave. At this point, the third harmonics reach 60MHz and 150MHz, exceeding the nominal bandwidth of 50MHz. Particularly at 50MHz, this equates to only five sampling points per cycle, making waveform reconstruction from five points impractical. Nevertheless, the frequency can still be accurately measured, which is quite commendable.
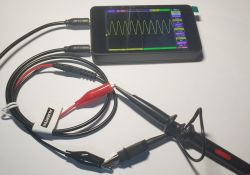
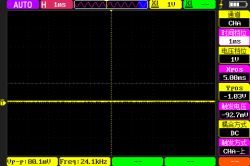
IV. AC (Mains Power) Waveform Testing
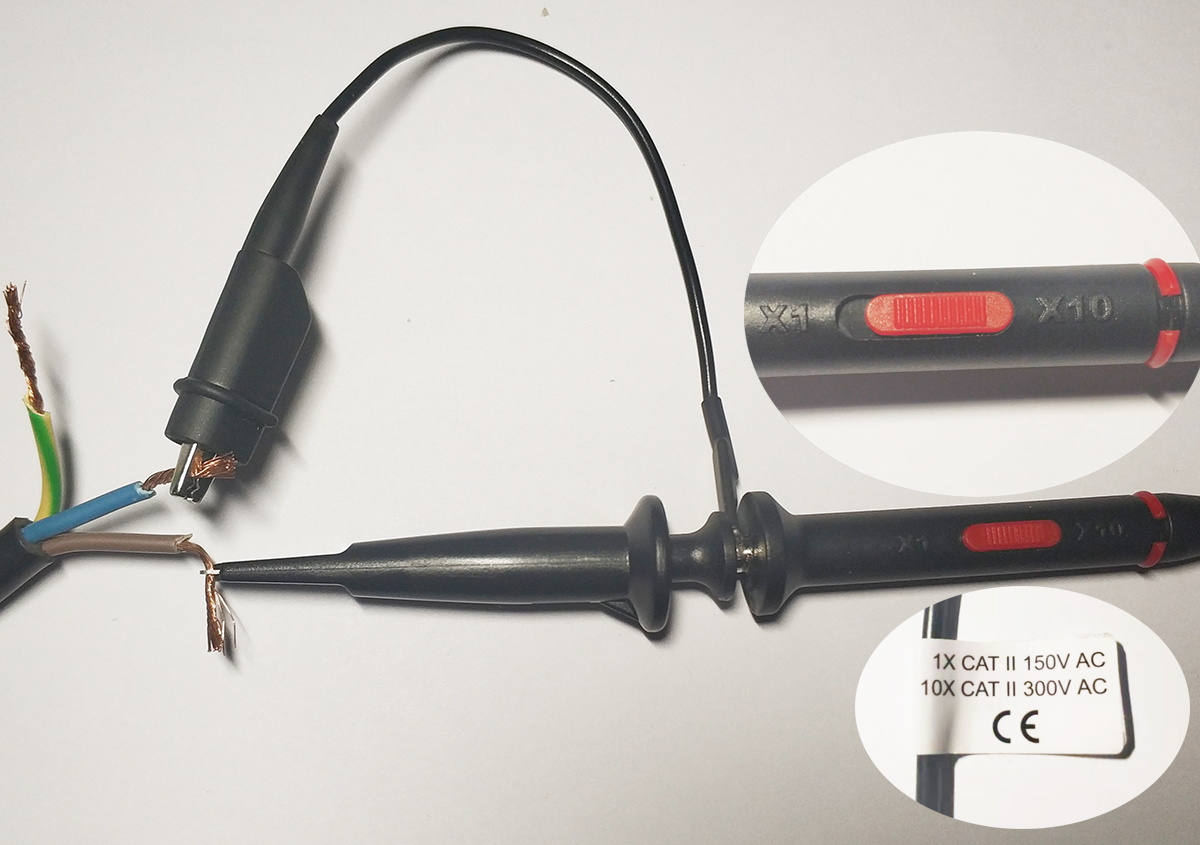
For mains power measurements, the safest method is to use high-voltage differential probes. However, direct measurement is also possible provided safety precautions are strictly followed.
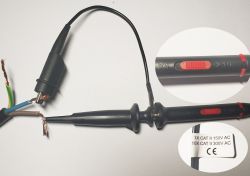
According to the probe label, the 10X setting can measure 300V AC. Therefore, set the probe to the 10X setting and connect it to the L and N terminals of a 220V AC source. Note that battery power should be used whenever possible for floating ground measurement—do not connect the USB cable.
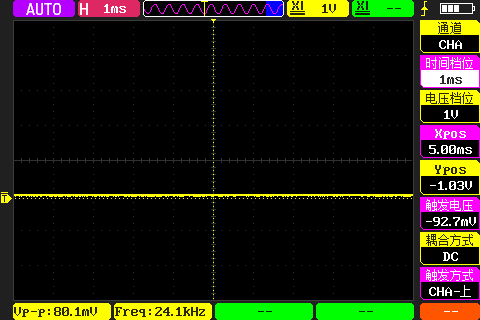
Set the oscilloscope channel gain to X10—power on to observe the waveform. The sine wave appears quite good here.
V. Dual-Channel I²C Measurement
As an oscilloscope, one of its primary functions is to measure signals for fault analysis. Therefore, we will use IIC signal measurement as an example for testing.
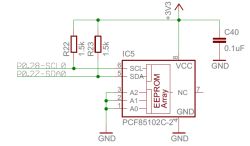
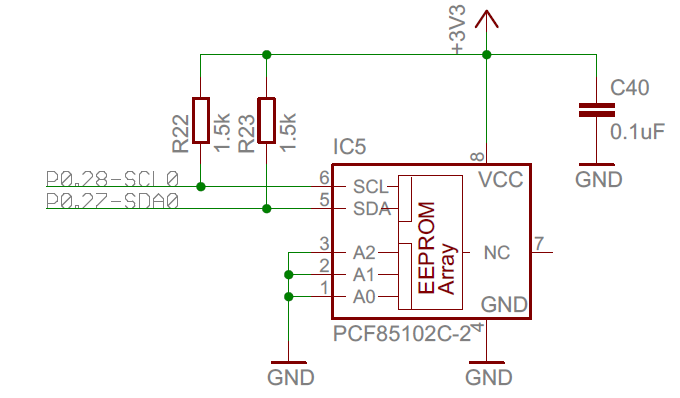
Here we measure an EEPROM on an I²C interface with a clock frequency of 100 kHz.

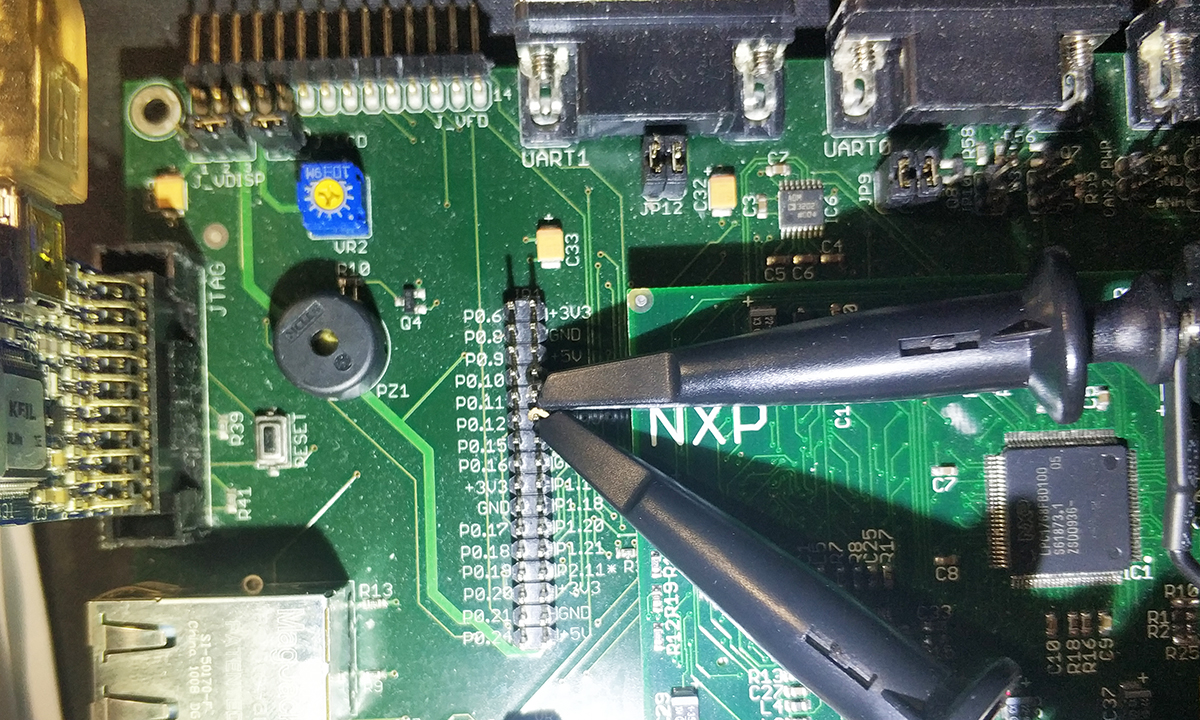
Two probes are connected to the I²C's SCL and SDA lines, respectively.
The oscilloscope can accurately measure the clock and data signals on the I²C pins. By analyzing the waveforms, we can determine if there are any issues with signal transmission on the I²C bus.
VI. Signal Generator Output
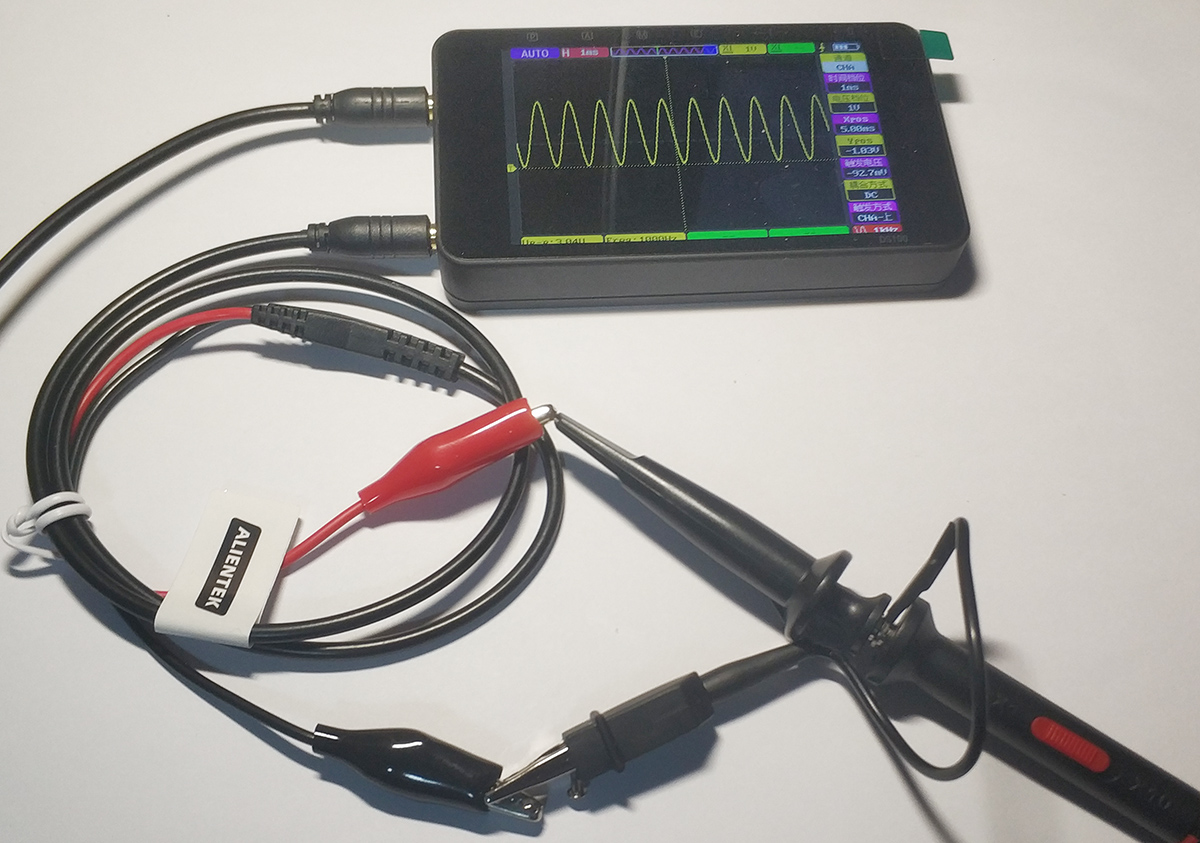
The DS100 also incorporates a basic waveform generator, whose outputs can be utilized by other devices. By connecting the included cables and probes, we can measure the waveforms it generates.
Using 1KHz as the base frequency, we measured the output square wave and sine wave, and the waveform output was quite perfect.
Triangular and sawtooth waveforms at the same frequency also output without issues.
Setting the output waveform to "—" effectively turns off the output, making waveform measurement impossible.
VII. Uploading Measurement Results
The oscilloscope incorporates 16MB of SPI FLASH internally for storing screenshots and waveforms. Currently, measurement results can only be saved as bitmap files.
After connecting the USB to the host computer, select USB in the oscilloscope menu. A virtual USB drive with approximately 16MB capacity will appear on the host computer.
Opening the USB drive reveals waveform bitmap files stored by the oscilloscope, available for user waveform analysis.
VIII. Battery Life and Charging
The parameter list does not specify battery capacity, but it provides an approximate battery life of 7 hours. When I received the device, it was not fully charged. After intermittent use over 3 days totaling about 4-5 hours, the screen rapidly dimmed and the device automatically shut down.

After the battery was fully depleted, charging began. Rough measurements indicated a charging power of approximately 4.3W, likely the maximum charging power at this stage.
Based on this measured maximum charging power, the "5-pin, 1-amp" power adapter included with the oscilloscope is reasonably sized.
IX. Conclusion
The DS100Mini oscilloscope offers a generally positive experience, though I feel there's room for improvement. For instance, the 3.5-inch screen is a bit small—a 7-inch display would be ideal. For standard communication protocols like I²C, it currently only measures waveforms. Adding protocol analysis functionality would be highly convenient. Currently, measurement results seem limited to saving as bitmaps. Saving them as raw data sets would be more practical, allowing analysis after downloading the data to a host computer.

Comments
The description of the oscilloscope parameters is very lacking. The 50 MHz bandwidth seems more reasonable than the 100 MHz at FNIRSI, but is 250 MSa/s correct? The ZT-603S was supposed to have 280 MSa/s... [Read more]