logo elektroda
logo elektroda
X
logo elektroda

HDD vs SSD - we measured the power consumption.

TechEkspert 105744 41
ADVERTISEMENT
Treść została przetłumaczona polish » english Zobacz oryginalną wersję tematu
  • HDD vs SSD - we measured the power consumption.
    Current measurement results in 5V and 12V branches of HDDs and SSDs.

    Currently, there are miniature platforms with SATA connectors that allow you to build many interesting devices equipped with capacious and fast hard drives. We checked the current consumption of HDDs and SSDs, the information may be useful for you when building a home NAS or other device equipped with a SATA connector. The type of disk selected will affect both the power consumption of the device, but also the type of power supply required or the battery life (e.g. during a power outage or operating as a portable device). Regardless of whether you want to replace the disk in your laptop or use a hard disk in your design, it is worth choosing its type well.

    In short, the results can be viewed in the video below or read more later in the article.


    Accepted measurement principles.

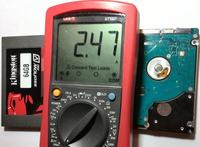
    To measure the current in the 5V and 12V branches, multimeters were used, set to measure direct current at the maximum range. By accepting a lower resolution and accuracy, we obtain a low internal resistance of the ammeter, thanks to which we have little interference with the hard disk (voltage drop). The voltages on the 5V and 12V rails were 5.13V and 12.15V, respectively.
    The current consumption was measured for:
    -state of inactivity (idle)
    -state of sequential write
    - sequential read status (seq read)
    -search status / access time (seeking)
    Measurements were made using the maximum capacity of the disk (eg checking the maximum read / write speed), the power consumption in "quieter" operation may be lower.

    We will check whether the power consumed by the disk depends on the operations it performs. Current values have been rounded to two decimal places, power consumption values to one decimal place.

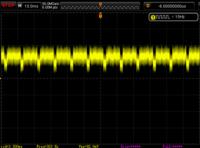
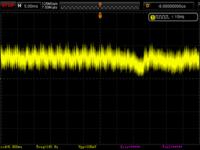
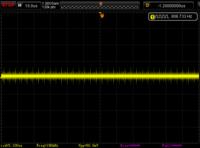
    Additionally, we checked the shape of the current waveform in the supply branches with the use of an oscilloscope measuring the voltage drop across a 0.1? resistor, which was included in the tested branch. Channel sensitivity was set to 50mV / div for all measurements.

    The test was selected from modern and older disk models, 2.5 "and 3.5", dedicated to NAS / RAID solutions, as well as popular "laptop" drives.
    As far as possible, disks of one manufacturer / product lines of disks were selected for the test. The disks were provided by those interested in taking such a measurement, we do not have unlimited resources, also the disk models are somewhat random ...

    HDD 3.5 "dedicated to work in SATA NL class RAID.

    type of disk test result of the test branch current 12V branch current 5V power comments
    WD RE4 2TB idle - 0.58A 0.35A 8.8W starting current ~ 1.8A
    WD RE4 2TB seq write 125MB / s 0.55A 0.80A 10.8W
    WD RE4 2TB seq read 126MB / s 0.55A 0.75A 10.5W
    WD RE4 2TB seeking 12ms 0.76A 0.42A 11.4W
    WD RE 1TB idle - 0.37A 0.17A 5.4W prąd podczas startu ~1.8A
    WD RE 1TB seq write 128MB/s 0.37A 0.72A 8.2W
    WD RE 1TB seq read 120MB/s 0.36A 0.65A 7.7W
    WD RE 1TB seeking 12ms 0.56A 0.32A 8.4W
    Seagate ES.2 1TB idle - 0.51A 0.31A 7.8W dość stary model
    Seagate ES.2 1TB seq write 99MB/s 0.51A 0.75A 10W
    Seagate ES.2 1TB seq read 97MB/s 0.51A 0.68A 9.7W
    Seagate ES.2 1TB seeking 13ms 0.51A 0.4A 8.2W


    In the case of HDD NL SATA, the power consumption fluctuates around 10W and may depend on the operations performed (it can reach 5W when idle). The higher the capacity, the higher the current consumption. Quite high power consumption during device start-up, in a matrix based on many disks, it is necessary to predict a greater demand for electricity at start-up and intensive work.

    HDD dedicated to work in home NAS.

    type of disk test result of the test branch current 12V branch current 5V power comments
    WD RED 1TB 3.5 " idle - 0.17A 0.25A 3.4W łagodny start
    WD RED 1TB 3.5" seq write 95MB/s 0.16A 0.46A 4.3W
    WD RED 1TB 3.5" seq read 96MB/s 0.16A 0.46A 4.3W
    WD RED 1TB 3.5" seeking 22ms 0.26A 0.28A 4.6W
    WD RED 750G 2.5" idle - 0A 0.3A 1.5W no current consumption in the 12V branch
    WD RED 750G 2.5 " seq write 95MB / s 0A 0.6A 3.1W
    WD RED 750G 2.5 " seq read 106MB / s 0A 0.5A 2.6W
    WD RED 750G 2.5 " seeking 17ms 0A 0.4A 2.1W


    You can see optimization for low power consumption, drives in the 2.5 "version usually do not require a 12V power supply and consume less current.

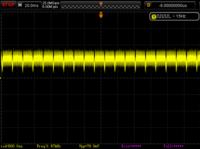
    Let's see what the shape of the current consumed while writing by the 3.5 "WD RED 1TB drive looks like.
    5V bus:
    HDD vs SSD - we measured the power consumption.

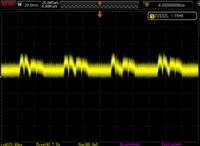
    You can see changes in the current consumption depending on the operations performed, the peak current reaches 0.8A, the minimum current is about 100mA. You can see the impact of the drive's operation on the current consumption in the 12V branch:
    HDD vs SSD - we measured the power consumption.

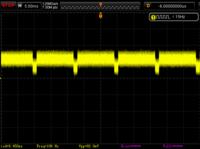
    Read operations cause similar changes in current consumption (5V branch):
    HDD vs SSD - we measured the power consumption.


    2.5 "" laptop "drives.

    type of disk test result of the test branch current 12V branch current 5V power comments
    HGST 0.5T Travelstar Z7K500 idle - 0A 0.17A 0.9W 7200 rpm
    HGST 0.5T seq write 135MB / s 0A 0.6A 3.1W
    HGST 0.5T seq read 122MB/s 0A 0.58A 3W
    HGST 0.5T seeking 16ms 0A 0.5A 2.6W
    WD SCORPIO 320G idle - 0A 0.25A 1.3W
    WD SCORPIO 320G seq write 61MB/s 0A 0.57A 2.9W
    WD SCORPIO 320G seq read 54MB/s 0A 0.4A 2.1W
    WD SCORPIO 320G seeking 18ms 0A 0.38A 2W
    Seagate momentus 500GB idle - 0A 0.1A 0.5W
    Seagate momentus 500GB seq write 53MB/s 0A 0.45A 2.3W
    Seagate momentus 500GB seq read 101MB / s 0A 0.45A 2.3W
    Seagate momentus 500GB seeking 18ms 0A 0.4A 2.1W


    2.5 "" laptop "drives show low power consumption and no power consumption in the 12V branch.
    Shape of current consumption during recording:
    HDD vs SSD - we measured the power consumption.
    and reading:
    HDD vs SSD - we measured the power consumption.
    is characteristic of magnetic disks.

    The current consumption can be reduced by giving the disk a stop command. It takes time for the drive to come to a running state from a stopped state.


    Stopped power consumption:
    type of disk current consumption 12V current consumption 5V power
    WD RED 1TB 3.5 " 0A 0.17 0.9W
    WD RED 750GB 2.5 " 0A 0.09A 0.5W
    HGST 500GB 2.5 " 0A 0.06A 0.3W
    WD SCORPIO 320GB 2.5 " 0A 0.08A 0.4W


    2.5 "SSD disks.

    type of disk test result of the test branch current 12V branch current 5V power comments
    Kingston 64GB SSD idle - 0A 0.25A 1.3W starszy model większy prąd
    Kingston 64GB SSD seq write 92MB/s 0A 0.6A 3.1W
    Kingston 64GB SSD seq read 165MB/s 0A 0.5A 2.6W
    Kingston 64GB SSD seeking 0.2ms 0A 0.3A 1.5W
    Kingston 128GB SSD idle - 0A 0.07A 0.4W
    Kingston 128GB SSD seq write 104MB/s 0A 0.5A 2.6W
    Kingston 128GB SSD seq read 168MB/s 0A 0.4A 2.1W
    Kingston 128GB SSD seeking 0.2ms 0A 0.3A 1.5W
    GoodRAM 240GB SSD idle - 0A 0.01A 0.1W
    GoodRAM 240GB SSD seq write 198MB/s 0A 0.58A 3W
    GoodRAM 240GB SSD seq read 394MB/s 0A 0.47A 2.4W
    GoodRAM 240GB SSD seeking 0.08ms 0A 0.2A 1W


    In the case of SSD drives, the visible advantage is the low power consumption during idle time (as well as short access time and high read and write speed).
    SSD technology is advancing, capacity is increasing, power consumption is lowered, bandwidth is increasing, and access time is lowered.

    The shape of the current in the 5V line when writing for the GoodRAM disk:
    HDD vs SSD - we measured the power consumption.

    Shape of the current when reading:
    HDD vs SSD - we measured the power consumption.
    Current cycles are faster than magnetic disks.

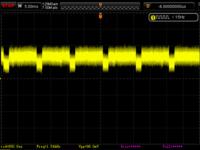
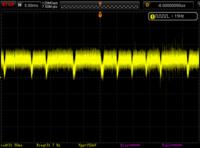
    During the waiting state, you can see cyclical increases in power consumption (internal disk controller work, or maybe an internal pulse converter?):
    HDD vs SSD - we measured the power consumption.


    Have you come across interesting experiences while selecting hard drives, maybe you will present the results of your own measurements?

    Part II - More accurate measurements and comparison of SSD and HDD power consumption at lower than maximum write speeds.

    Cool? Ranking DIY
    About Author
    TechEkspert
    Editor
    Offline 
    TechEkspert wrote 6229 posts with rating 4890, helped 16 times. Been with us since 2014 year.
  • ADVERTISEMENT
  • #2 14529836
    TomekxD
    Level 29  
    The table is invisible on the black board style.
  • #3 14530135
    mdm150
    Level 27  
    So as it turns out, SSD is not so energy-saving in the active state ...
  • ADVERTISEMENT
  • #4 14531074
    qba3
    Level 12  
    Yes, the read speed of the search write and the lower power consumption leave no illusions as to what is better ... maybe the price and available capacity are not equal to the HDD, but on a daily basis I use the SSD as the primary for the system, etc. and the HDD for the data in the laptop and the difference is knocking windows 7 with services starts in 20 seconds ...
  • #5 14531343
    TechEkspert
    Editor
    TomekxD in fact, the text of the tables is invisible when the forum style is black, I reported, we'll see what we can do.

    mdm150 everything is relative, SSDs at their maximum capacity consumed similar power to 2.5 "HDD, but SSDs are more efficient, so they will finish the operation faster than HDD and thus the amount of energy consumed may be lower.

    qba3 Yes, the advantages are undeniable, both in home and business applications, more and more flash drives.

    Finishing this article, I accidentally agreed with another interesting topic in this section: Longest SSD test completed Unfortunately, we do not have the resources for such tests ;)
    but if you have interesting ideas for other attempts, try to implement them and post the results, you can also suggest some attempts, maybe another person will be able to do them ..
  • #6 14531407
    .......
    Level 12  
    TomekxD wrote:
    The table is invisible on the black board style.
    I already got used to it, ctrl + a helps.
  • ADVERTISEMENT
  • #7 14531425
    TomekxD
    Level 29  
    I know that, but from the phone how? :)
  • #8 14533364
    BANANvanDYK
    Level 42  
    Why were the model designations not included in the test? For example, Hitachi / HGST uses the HTE and HTS designations, there is a fundamental difference here because the former are drives designed for "office" 8 hours a day / 5 days a week, while the latter are drives designed for 24/7 operation.
    All manufacturers publish datasheets of their hard drives, and there are also detailed information on power consumption in various operating conditions. This test is a bit like shooting yourself in the foot.
    Coming back to the first point. Drives for 24/7 operation have the firmware optimized in terms of mechanical strength and more even power consumption (no low power consumption feature required in laptop drives).
    2.5 inch drives have an advantage here due to lower power consumption, with limited disk capacity and reduced transfers.
    Considering the self-made devices for Rapsberry etc. an important issue is the power supply only 5V, where all laptop drives only use 5V. With 24/7 drives, things are different here, because 12V needs such drives, and others do not. Typical 2.5-inch server drives always need 12V, but this is a completely different product class.
    Why a 24/7 drive? People put regular Seagate 3.5-inch drives into NAS, and they all crashed after 1-2 years ...
    After all, SSDs are not suitable for storing large amounts of data. First, lower capacity and high price. The problem of durability after the number of write cycles can probably be ignored. Unless there is an emphasis on fast data availability or frequent writes and reads, then SSHDs come to the rescue.
  • #9 14534509
    SStaszekk
    Level 9  
    TechEkspert wrote:


    To measure the current in the 5V and 12V branches, multimeters were used, set to measure direct current at the maximum range. By accepting a lower resolution and accuracy, we obtain a low internal resistance of the ammeter, thanks to which we have little interference with the hard disk (voltage drop).


    So what is the accuracy of the measurements? On a quick check meter UT58D + - 2% + 5c So 20A * 2% = + - 400mA + 5c
    Meter 1009
    10 A * 1.6% + 4c = + - 160mA + 4c
    It seems to me that even without taking into account the least significant digits, the measurement error makes the measured values useless? Can you please confirm my reasoning?
  • #10 14534952
    Darkdarkman
    Level 30  
    It is not known for the end :D
    There should be a definition of this accuracy in the meter manual.
    If there was an accuracy class, it could be precisely defined.
    2.0 would mean that the error limit does not exceed 2% range values , a
    2.0 in a circle - that 2% of the measured value.
    Either way, a device that measures a quantity with an error of 2% can be taken as an indicator. Meaningful measurements could be made with an accuracy class of 0.5 or an accuracy of 0.5%
    (For digital meters there is no strict accuracy class parameter)
  • #11 14535057
    SStaszekk
    Level 9  
    Darkdarkman parameters given by me come from the manual of the gauges.
  • #12 14535117
    Darkdarkman
    Level 30  
    I downloaded the manual - the accuracy is described as 2% indications .
  • #13 14535549
    SStaszekk
    Level 9  
    So in the case of UTD58 it is 2% of the reading + 5c. And 5c in this case is 50 mA?
  • #14 14535654
    Darkdarkman
    Level 30  
    More like 5mA.

    [edit] - auto-patch.
    Yes, 50mA
  • #15 14535666
    SStaszekk
    Level 9  
    I don't understand the 5 least significant digits. UTD has 2 digits after the decimal point so I get 50 mA
  • ADVERTISEMENT
  • #16 14535792
    TechEkspert
    Editor
    The HGST disk from the "laptop" group was provided as standard on a laptop and therefore it is the HTS series (standard S).

    As for the accuracy, the test assumed the achievement of differences in results between different types of disks and differences between disk modes, these differences are visible and were reproducible during the tests.

    The UT58D was used to measure the current in the 12V branch and was used in the measurements of NL SATA drives designed for RAID operation and one 3.5 "WD RED drive designed for NAS operation.

    For the 5V line, a slightly more accurate meter 1009 was used. Due to the accepted inaccuracy of the measurement, the power was calculated with a resolution of up to 0.1W, mainly to check the repeatability of the differential results between disks, and not to determine the power consumed with an accuracy of 0.001W.

    In tests, I did not go into detailed disk models and firmware revisions, it was more about comparing disk classes (disk resources were limited to those that were made available anyway).
    The following classes were presented: HDD 3.5 "NL SATA for use in RAID, HDD 2.5" and 3.5 "dedicated to NAS, HDD 2.5" "laptop", SSD with various capacities (and thus the year of production).
    Similarly, when it comes to the power of individual copies, the goal was not to measure with an accuracy to milliwatts, but to show the trend and differences between the disks.

    There were very interesting discussions in the thread, I will try to prepare a continuation of this material if possible. Maybe you are able to implement your own ideas and present the results of your attempts on the forum?
  • #17 14536563
    Darkdarkman
    Level 30  
    TechEkspert wrote:
    Due to the accepted inaccuracy of the measurement, the power was calculated with a resolution of up to 0.1W, mainly to check the repeatability of the differential results between disks, and not to determine the power consumed with an accuracy of 0.001W.


    It's not like that. You do not write what you measured the voltage with. If you used the same methodology to measure the voltage, the measurement error for 12V resulting from the resolution of the meter at 1000V DC is 1V, plus 0.8% of the reading plus 2c
    I assume you measured this voltage in the 20V range. Here you have an accuracy of 0.5% of the reading. i.e. 12.15V ? (12.15V * 0.005 + 2 * 0.01V) = 12.15V ? 0.07V.
    For this current, let's say 0.58A ? (0.58A * 0.02 + 5 * 0.01A) = 0.58A ? 0.03A
    Power P ? 7.05W. The sensitivity factor for the current 0.58A, for the voltage 12.15V, the standard uncertainty of the power measurement is therefore ? 0.85W, i.e. 12%

    I must admit that I could have confused something, because I dealt with metrology recently in my studies.

    SStaszekk wrote:
    I don't understand the 5 least significant digits. UTD has 2 digits after the decimal point so I get 50 mA

    Here you are right on the range 00.00A error 5c = 5 * 0.01A = 0.05A = 50mA
  • #18 14536736
    TechEkspert
    Editor
    Exactly yes, in the case of voltage measurement, there were no technical limitations to apply the measurement method that guarantees the best accuracy available at the time of the test, which does not change the fact that the main source of error here is the current measurement method that ensures low voltage drop and proper disk operation.

    Also, the adopted resolution of 0.1W calculations is below the capabilities of the measuring system, but let's be honest, even 9 digital multimeters will not make the 3.5 "SATA NL drive use less power than the 2.5" drive intended for the NAS. Well, resolution and accuracy are two different things :) the results of power measurements can be rounded, for example, to full watts, a lot in the characteristics of disk groups will not change this.

    While trying to define the characteristics of different groups of disks, a very interesting discussion on metrology emerged.

    You can also check how the power consumption is influenced by the configuration options of the disks (e.g. acoustic management) or the behavior of the disk when powered up (e.g. spin-up time)
  • #19 14541872
    gRRubasek
    Level 14  
    Everything is nice just these gauges sucks. Both the UT58D and the Kyoritsu 1009 do not show the true RMS value (they are not TRMS).
    In addition, most, and basically all manufacturers provide data on energy consumption in individual work cycles.
    http://www.wdc.com/wdproducts/library/SpecSheet/ENG/2879-771438.pdf
    It seems they are legally obliged to do so. Of course, you can check how the given data relates to reality, but you would have to be better prepared for it.
    Nice pictures of Rigola, but basically useless.
    I apologize for the criticism, but there are a lot of such tests on the Internet and when you do another one, you can present something meaningful in it.
  • #20 14546664
    TechEkspert
    Editor
    They don't suck that much :) the fact they do not have TrueRMS and this is a serious drawback, the "pictures" from the oscilloscope show the shape of the current changes, which cannot be obtained in a meter even with TRMS.

    It is known that almost everything is already measured and weighed and car manufacturers indicate fuel consumption, for example, in the urban cycle, but should this prohibit us from looking under the hood?
    Sometimes it is worth taking a multimeter in your hand and going beyond paper specifications, by the way, you can provoke interesting discussions.

    Constructive criticism is always interesting to me, the measurement itself, as you write, can be done better and it may be possible to achieve it.

    For me, your comments are very interesting, both on the topic, as well as on PW and YT, I will try to prepare the second part of this material, taking into account the changes that I can implement and bringing something new.

    The topic of SSD is heavily exploited, but in this content I do not see a duplication of available materials on the network, in addition, you have a direct impact on how the further development of this article will go.
  • #21 14547724
    Darkdarkman
    Level 30  
    You know, the problem with these measurements is in fact only done with SSD measurements.
    5.13V + (5.13V * 0.005 + 2 * 0.01V) = 5.13V ? 0.05V
    0.25A + (0.25A * 0.02 + 5 * 0.01A) = 0.25A ? 0.06A

    sensitivity factors of 0.05V; 0.06A
    P = 1.28W ? 0.26W - here you already have an error of 20%


    It is even worse for subsequent measurements:

    5.13V + (5.13V * 0.005 + 2 * 0.01V) = 5.13V ? 0.05V
    0.01A + (0.01A * 0.02 + 5 * 0.01A) = 0.25A ? 0.05A

    P = 0.01W ? 0.05W - even ignoring the nightmarish rounding errors, here it is just nonsense.

    If you want these measurements to be of any value, use a gauge with an accuracy class of 0.5 or better. Put the results with a decent calculation of errors, do not worry about the voltage drop on the ammeter, because it is irrelevant for these measurements.
  • #22 14548669
    TechEkspert
    Editor
    The current consumed during idle time differed by an order of magnitude from the current during recording,
    that's why I left the results of these measurements more as informative, showing how much current change we are dealing with, and not an exact determination of the power consumed in the idle state.

    The measurements were performed with certain assumptions and possibilities (mainly as obtaining differences between individual groups of disks), as to the rounding, they were consistent with the adopted resolution of 0.1W results.

    One of the things I'm going to do is just use a bit more accurate measuring equipment, which you write about.
    We will see what effects can be achieved.
  • #23 14550174
    gRRubasek
    Level 14  
    TechEkspert wrote:
    They don't suck that much :) the fact they do not have TrueRMS and this is a serious drawback, the "pictures" from the oscilloscope show the shape of the current changes, which cannot be obtained in a meter even with TRMS.

    When measuring in this way, in the extreme case, when the compared current values are similar and the waveforms are completely different, it may turn out that the current consumption is completely opposite to your measurements. You can support yourself with oscilloscope measurements, such a Rigol or another DSO shows RMS values and many other parameters.
    TechEkspert wrote:
    It is known that almost everything is already measured and weighed and car manufacturers indicate fuel consumption, for example, in the urban cycle, but should this prohibit us from looking under the hood?

    In the case of hdd / ssd, these parameters are easily verifiable and I do not think manufacturers are dim as in the moto industry. Of course, it's always worth checking, but so that your measurements, in turn, are undisputed.
    TechEkspert wrote:
    The topic of SSD is heavily exploited, but in this content I do not see a duplication of available materials on the network, in addition, you have a direct impact on how the further development of this article will go.

    There are really a lot of these types of comparisons, sometimes compared to performance benchmarks.
  • #24 14550216
    TechEkspert
    Editor
    That's right, the waveforms of a strange shape can strongly distort the result, just as you write, in the extreme case the result may be the opposite.
    Oscilloscope functions + "optical" control is a good idea to use for these measurements.

    Thanks for all the hints, as soon as I borrow the appropriate equipment, I will try to prepare the material.
  • #25 14555361
    freebsd
    Level 42  
    I read the above tests before all comments were made. I thought it was a fun, interesting test. I left it to scrutinize it for a later date, and then there were more comments.

    I noticed that there was a relatively small difference in power consumption between 2.5 "drives and SSDs. Taking the average of all the intended powers, I got an average of 2.1W (HDD) and 1.8W (SSD). Very little difference. I pass. I realized that the calculated value is "under the big finger", but still I expected a bigger difference in energy consumption.

    I have several disks and a wattmeter at home. So I decided to make similar measurements. Similar but not identical! One time I do not have such disks, and two I used a different measurement method. The disks that I used are not the youngest anymore, but only such disks were "loose": Newer ones work in computers :-)

    I ran 6 tests, each lasting 30 minutes, on each of the drives. This means that I tested each disk for 3 hours. I used the tests I called "stanby", "write", "read". I tried to minimize the impact of the RAM cache by cyclically synchronizing the cache with the disk, and by unmounting and mounting the test partition between two test rounds.
    I wanted to simulate the "normal" operation of the drives as possible and invented such tests. I am curious about your opinion on this method of testing . Maybe my work will inspire test authors to carry out other types of tests?

    So far, for one proven SSD drive, the average energy consumption was 522.67 mWh, and for two 2.5 "HDDs, 1203.19 mWh and 1120.77 mWh. SSD vs HDD how much energy does the drive use
  • #26 14555749
    Darkdarkman
    Level 30  
    freebsd wrote:
    I noticed that there was a relatively small difference in power consumption between 2.5 "drives and SSDs. Taking the average of all the intended powers, I got an average of 2.1W (HDD) and 1.8W (SSD). Very little difference. I pass. I realized that the calculated value is "under the big finger", but still I expected a bigger difference in energy consumption.

    Remember that the above measurements are burdened with a terrible measurement error.
  • #27 14556094
    gRRubasek
    Level 14  
    Ordinary 2.5 '' drives, i.e. usually intended for portable devices, are very energy-efficient, so it's no wonder that they use up as much as a dozen or so SSD memory cubes. A small motor, usually one platter, a "speaker" circuit to move the head and some electronics in one or two ICs.
  • #28 14556270
    TechEkspert
    Editor
    freebsd in the tests you have carried out I like their lower "synthesis" than in mine, additionally you measure the energy consumed by the disk in time and not the power at a specific point in time. The measured energy value will be a certain average of the performance characteristics.

    The first thing is, I am very glad that I managed to inspire someone to try them out in a different way.

    The second thing, the feedback that arises in the topic allows you to get much more than originally assumed. Thanks for the hints!

    I tried to make a bit more accurate measurements and check the power consumption at different write speeds (not only at the maximum capacity of the drives, which for HDD and SSD are significantly different).

    I put the second part of the material, which was mainly due to the comments I received in this thread, on PW and YT.

    Part II - More accurate measurements and comparison of SSD and HDD power consumption at lower than maximum write speeds.
  • #29 14556296
    freebsd
    Level 42  
    TechEkspert wrote:
    reebsd in the tests you have carried out I like their lower "synthesis" than in mine, additionally you measure the energy consumed by the disk in time and not the power at a specific moment. The measured energy value will be a certain average of the performance characteristics.

    I think that the set of tests gives a comprehensive overview of the matter. Therefore, I read this thread with great curiosity.
  • #30 14573871
    freebsd
    Level 42  
    Until now, I took it for granted that writing data to disk consumes more energy than reading. I will refer to 2.5 "mechanical drives, which are still often used in laptops, where energy consumption is of particular importance.
    TechEkspert data indicates an equilibrium in energy consumption (the measurement error is the same for seq write and seq read). For the WD Scorpio 320G drive, they even confirm higher energy consumption when writing than when reading. These measurements already indicate an interesting thing for me, because I expected that the current consumption for the reading was small, and significantly it grows only on saving.
    My measurements (entry # 25) show even more clearly that writing to disk is not the most energy-consuming operation. The power consumption results indicate that reading data (2.5 "mechanical drives) uses more power than writing. The most common operation uses the most energy.

Topic summary

The discussion centers around the power consumption measurements of HDDs and SSDs, particularly in the context of building devices with SATA connectors, such as NAS systems. Users share insights on the energy efficiency of SSDs compared to HDDs, noting that while SSDs can consume similar power at maximum capacity, they often complete operations faster, potentially leading to lower overall energy use. Concerns are raised about the accuracy of the measurements due to the limitations of the multimeters used, with suggestions for using more precise equipment. The conversation also touches on the differences in power consumption during read and write operations, with some users noting unexpected results regarding energy usage patterns. Various brands and models of SSDs and HDDs are mentioned, along with discussions on measurement techniques and the implications for device design.
Summary generated by the language model.
ADVERTISEMENT