logo elektroda
logo elektroda
X
logo elektroda

Huawei SUN2000 Inverter: WIFI Dongle Connection, Firmware Update & FusionSolar

Bob271 367701 1354
ADVERTISEMENT
Treść została przetłumaczona polish » english Zobacz oryginalną wersję tematu
  • #1291 21212486
    webonek
    Level 11  
    >>21212484 .
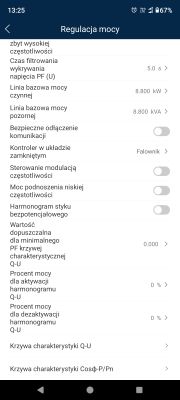
    I looked in the app - no, there is no compensation, in the sense that 1 seems to have been entered. But I can still check that.
    Or I can enter manually in the web panel, only I don't know what value, because the range I have is [-5,280~5,280] kVar ? When I click "default setting" it says: "enter correct correction value".
    As for the graph, I know that on www - but where exactly?
  • ADVERTISEMENT
  • #1292 21212498
    mateos2
    Level 12  
    >>21212486 .

    monitoring -> select inverter on the left and historical data on the right

    for the reactive power settings - simply upload the screenshot from the same place, but select on the right - configuration
  • ADVERTISEMENT
  • #1293 21212521
    webonek
    Level 11  
    And that's where I was, only that it only displayed active and input power. Any specific parameters to select, as I see the list is - for the graph? I have a choice of phase voltages A,B,C and amperages A,B,C. I can select either just the voltage or the amperage.

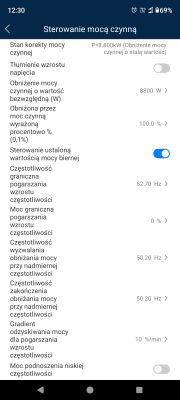
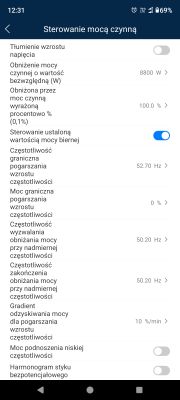
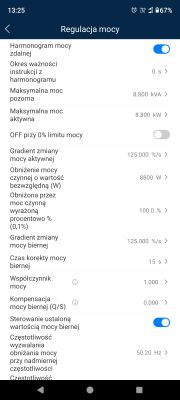
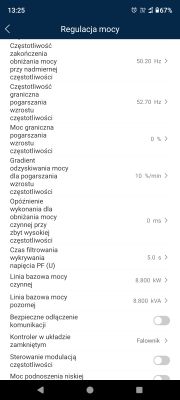
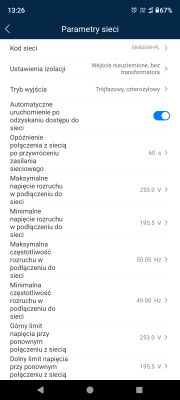
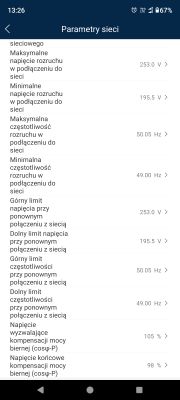
    Screenshot of the active power control settings menu on a mobile device. Screenshot of active power control settings in a mobile app. App screen for reactive power control showing correction status and selection option. Power regulation settings screen in an app showing various parameters. Power regulation settings screen in an app showing various parameters. Power regulation settings screen on a phone with various parameters and options. Screenshot of power regulation settings in a mobile app. Screenshot showing electrical network parameters settings on a mobile device. List of electrical network parameters on a phone screen. List of electrical network parameters on a phone screen.
  • #1294 21212534
    mateos2
    Level 12  
    webonek wrote:
    And that's where I was, only that it only displayed active and input power.
    .

    totally serious - look again and click on the box to the right of "Signal point" - where it says "Selected 2" - spend 15 seconds and you will find it.
    Note that your speed and laziness may be taken by people trying to help as laziness and wasting their time.


    and applications, _seriously_, close and forget - there you go, if you understand the meaning of the options and their operation as described in the manufacturer's manual.
    if you play around and change something, HW support will tell you that it works correctly even if there is no production - because someone set it up and that is how it should work.
  • #1295 21212548
    webonek
    Level 11  
    >>21212534 .
    You write a bit as if I don't reply or reply after a few hours or days - and I reply immediately.
    Where I have "signal point" on the right it says "selected2". But as I wrote - the active and input power graph appears. I asked - what should I look for or what should I mark? And you don't write anything about what to do with what I see - should I include the active and input power graph or was it also about the currents though...? As I develop the list, I have - as I wrote above: phase ABC and current ABC. And what...?
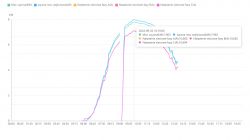
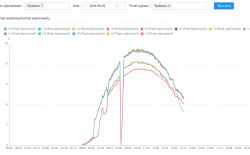
    Such a graph...? This is from today - this break is my handwritten one.
    Graph of active power and network currents for phases A, B, and C. .
  • #1296 21212558
    mateos2
    Level 12  
    >>21212548
    PV1 input intensity
    PV2 input voltage
    PV1 input voltage
    PV2 input voltage
  • #1297 21212563
    webonek
    Level 11  
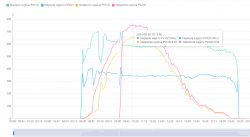
    And you see...! I didn't have a swipe bar, so I didn't know this list could be swiped - my bad, even though it's so out of touch with Huawei's site, for first time visitors. It wasn't until you wrote that it helped :) .
    The graph shows changes in voltage and current for PV1 and PV2 inputs over time.
  • #1298 21212572
    mateos2
    Level 12  
    >>21212563 .
    in my opinion you have shadows on the panels
    and tell me - don't you have an 8KTL-M0 inverter?
  • #1299 21212575
    webonek
    Level 11  
    Well, but there is no shadow just :( Additionally - it was pouring yesterday, so even if some dirt, it would have washed off a bit. And is the shadow indicated by this wrinkling of the graph or something else?

    I have a SUN2000-8KTL-M1 - and why do you ask?

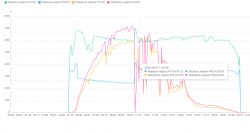
    Here's another graph from a month ago - marked where there was a peak of 8.79 kW for a while at 11:25 a.m. But it was cloudy then, as you can see from the graph. Maybe this will help something:
    Graph showing voltage and current input for PV1 and PV2 with reference to time. .
  • #1300 21212598
    mateos2
    Level 12  
    >>21212575 .
    Show a graph from a day when there were no clouds at all but sunshine all day

    8ktl-m0 on 300V could not give full power on mppt
  • ADVERTISEMENT
  • #1301 21212603
    webonek
    Level 11  
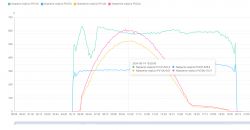
    Please. Maximum peak 8.1-8.2. But here there were 2 panels less on PV2 (375W), because the 2 pcs. 375W the team mistakenly connected to PV1 (325W). Therefore a voltage of 309V below the minimum optimum of 315V for PV2. Panels seemingly connected incorrectly, voltage too low, but.... the current became quite high, however.

    Graph showing the input voltage and current of two PV panels throughout the day.

    P.S. I have to go to work - I'll reply when I get back :) If you help effectively on this problem, I'll pay if you don't get offended :)
  • #1302 21212612
    mateos2
    Level 12  
    >>21212603 .

    it all works correctly - curious about the gap
    on the left under the inverter you have the option "optimisers"
    select it and similarly make the historical data (current) for all the options

    you also did not write how exactly the distribution looks like
    eg string 1: 16*panel X + 5 opts; string 2: 11*panel Y + 3 opts


    The optimiser works as follows
    changes the input voltage and intensity so that the output intensity is the same as the other panels, and the voltage is arbitrary

    if you have partial optimisation it may not work perfectly
  • #1303 21212622
    webonek
    Level 11  
    Graph of input and output current of a photovoltaic system on August 14. .
    Graph of output and input current from various optimizers in a photovoltaic system.
    One from a month ago, and the one "snapped" from today with the inverter's manual shutdown.

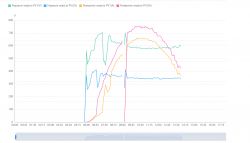
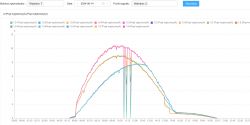
    PV1 is 19x325W - 3 optimisers: no 1, 6 and 7.
    PV2 is 11x375W - 4 optimisers: nos 2-5.
    Optimisers older P and newer P2.

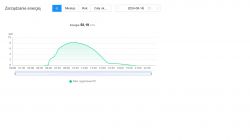
    Strange this drop from 14.08 if the power graph is like this:
    PV output power chart from 14.08.2024. .
    There was a lot of this (changes), but I think at the time there were temporarily 3 PV2 panels lying flat (14.08) on the roof to the north temporarily with 3 optimisers, also it was cutting off even 17V on the panel at the worst moment. Well, but the current was getting made nonetheless.
    Now they are all facing the same way - but only recently. I gave the 14.08 chart because the sun was out all day then.
  • #1304 21212639
    mateos2
    Level 12  
    >>21212622
    Echoing

    You can't plug in less than 6 Huawei optimisers on a single string - it stands like a bull in the data sheet.
  • #1305 21212703
    webonek
    Level 11  
    >>21212639 .
    I didn't know, but previously there were 3 optimisers on PV1 with a 5 kW inverter and it was OK.
    And where do you find this stipulation that the crew show?
    And what in such a situation - knock them out?
    Is the fact that there are few of them the reason for the low power? And Huawei support does not know about it...? :-o .
  • #1306 21212708
    mateos2
    Level 12  
    >>21212703 .

    stands at the end of the page:
    https://solar.huawei.com/en/download?p=%2F-%2...t%2Fpdf%2Fpl%2Fdatasheet%2FSUN2000-450W-P.pdf

    but can you show us the measurement report made by the installation team at the end of the work? the commissioning report? and where did you get the 375W panels from? because they are PV2 and as far as I can see they have a lower current than the old panels - it should be the other way round
  • #1307 21212725
    webonek
    Level 11  
    >>21212708 .
    But are you looking at this snapshot from August or today - as there were 2 fewer panels (9) on PV2 in August?
    I don't have the measurements - they were done by the same team as before PV1, only that before as employees and now independent they are. They only measured the opening voltages and supposedly it matched. They ordered the panels from a wholesaler supposedly new.
    However, on the graph I see a current of about 9A for PV1 (6kW) and over 10A for PV2 (4kW). Am I looking at it wrong or is the current higher on PV2? Just asking, no offence :) .
    This lower overall power may be caused by too low opt. per string - less than 6 each ?
  • #1308 21212765
    mateos2
    Level 12  
    >>21212725 .

    guesswork, but on pv2 you have newer mods and they should have more current
    but they have less
    maybe the optics are not working properly, maybe a panel is damaged, maybe they are counterfeit panels

    there are many possibilities

    as a consumer at the end of the day, compare the data sheets of the old and new panels - look at the Immpt for NOCT
    if the new ones are supposed to be bigger and they are smaller than the old ones - complain to the installer and they will fix it
  • #1309 21213067
    webonek
    Level 11  
    >>21212765 .
    But on which chart do you see this - because I'm a bit confused?
    I spoke to Huawei support: according to them these minimums of 6 are true, but only apply when fully optimised. In my case it doesn't matter, just as - in their opinion - it doesn't matter whether I enter the parameters of the panels (voltages, currents, drops, etc.) in the string parameters or not. Observation confirms the latter: there is no difference.
    Also, they have pointed out that my 8 kW inverter is not included in this '6 minimum' - but they have ticked off this full optimisation, although I don't know quite what it looks like.
  • #1310 21213129
    mateos2
    Level 12  
    >>21213067 .
    on PV1 you have panels with Impp 9.57A
    on PV2 you have panels with Impp 10.87A

    the current graph on PV2 should be 13% higher than on PV1
    (or even more, as the panels on PV1 are 3 years old)

    this is not the case - so either miraculously on PV1 you have panels 15% more powerful - almost impossible
    or on PV2 you have panel(s) that do not have the parameters

    in 95% you have either defective panel(s) or counterfeits
    do you have their serial numbers to check the originality?
  • #1311 21213150
    webonek
    Level 11  
    And it's not like you're looking at a graph from August, when 2 panels were misconnected and 3 panels (out of 9 on PV2) on the north side? I only posted that graph because - but I did point out a note - that it was cloudless.
    Then maybe take a look, please, at today's graph: here is the current higher on PV2 though? :) .
    The marked position is 10:15, when there was a peak of 7.8 kW. :)

    Graph showing voltage and current on two inputs, PV1 and PV2, throughout the day.
  • #1312 21213174
    mateos2
    Level 12  
    >>21213150 .
    I looked at today and some installations near Krakow.

    From a 10kwp installation today the max is about 7.2kW for a while
    And this is ok and no more will be
  • #1313 21213205
    symeks
    Level 15  
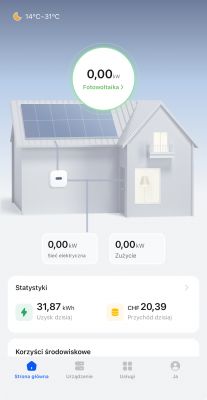
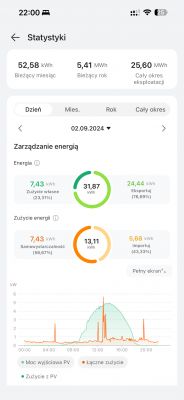
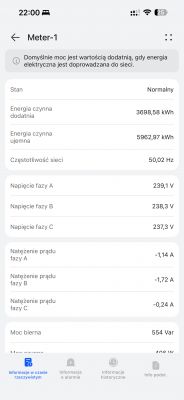
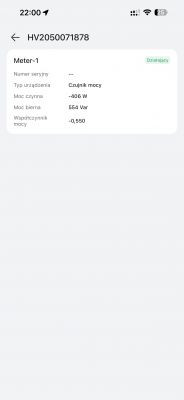
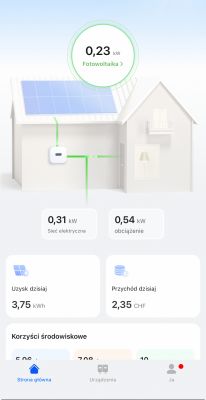
    Hi all. Some time ago I added a meter to my inverter and in the app, the home screen was showing the current consumption. I don't know when it stopped working, but when I go into the statistics it shows how much energy I have used. Does anyone know if there may have been an update along the way that may have broken this?

    Greetings


    Edit
    I've added a pic of how it was showing just after starting the meter.

    Screenshot of an app measuring solar panel energy, showing 0.00 kW consumption and production. Screenshot of an energy management app showing consumption and export statistics. Screenshot of an inverter monitoring app showing energy consumption data. App screen showing power sensor operation data. App screen showing power sensor operation data.


    Screenshot of an app for monitoring photovoltaic energy usage. .
  • #1314 21213232
    mateos2
    Level 12  
    >>21213205 .
    update the app or wait
    Zeroes also show when the dongle loses connection to the server
  • #1315 21213240
    symeks
    Level 15  
    mateos2 wrote:
    >>21213205
    update the app or wait
    It also shows zeros when the dongle loses connection to the server
    .
    That's what I thought, but why does it show consumption after entering the graph?
  • #1316 21213272
    mateos2
    Level 12  
    >>21213240 .
    Because the graph generates from historical data and missing 5 minutes of data is not even noticed
    And the main page shows the last 5 minutes of data
  • #1317 21213292
    symeks
    Level 15  
    mateos2 wrote:
    >>21213240
    Because the graph generates from historical data and the absence of 5 minutes of data is not even noticed
    And the main page shows the last 5 minutes of data


    If this is the case then I guess I'm not so lucky that I end up with a missed connection every time. Are there other possibilities as well?

    Thanks for the feedback.
  • #1318 21213335
    mateos2
    Level 12  
    >>21213292 .

    Update applications
    They changed it recently something
  • #1319 21214277
    symeks
    Level 15  
    mateos2 wrote:
    >>21213292

    Update applications
    They changed it recently something


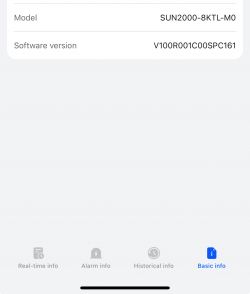
    I've done all possible updates, the inverter doesn't show that a newer version is available. And every time I check it is just zeros on the main screen. Is there a newer version? Screenshot with inverter model and software version information. .
  • ADVERTISEMENT
  • #1320 21214285
    webonek
    Level 11  
    >>21214277 .
    But where specifically does it show you that there is no newer version - because on me on the same but M1 is the latest version 165 and on you 161?

Topic summary

The discussion revolves around issues related to the Huawei SUN2000 inverter, specifically focusing on WiFi dongle connectivity, firmware updates, and the FusionSolar application. Users report difficulties in connecting the inverter to their home WiFi networks, with some resorting to using Ethernet cables for stable connections. Firmware updates are discussed, with users sharing experiences of updating both the inverter and the dongle, and the impact of these updates on inverter performance. The conversation also touches on the configuration settings for optimal production, including grid codes and reactive power compensation. Users express concerns about the limitations imposed by installers and the need for better access to their inverter settings.
Summary generated by the language model.
ADVERTISEMENT