I bought a barometer. The seller said there was a mistake, not 50pln but 500pln it was supposed to be. He refunded the money.
I bought another one - broken, it's sitting under the kitchen table waiting for a return label.
I bought a third one - a new USSR, but it didn't survive transport....
So much for the basic question "why do this, isn't it easier to buy on the alegro?", or: "they are available online - why waste time?".
I found the projects SECRET and closed on the electrode, so had to look elsewhere. It was supposed to be simple, easy, clear, not very expensive.
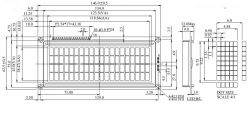
I rummaged through my resources. I had a display (about 50pln), a Nano (about 12pln), and for 4pln I bought an I2C SPI BMP280 3.3V pressure transmitter.
I used this development: Link but it proved problematic to use the AdaFruit BME280 product because of the price (over 70pln cheapest I could find).
I have converted the code to the following, as the regular BME280 does not support all the commands as the AdaFruit does:
.
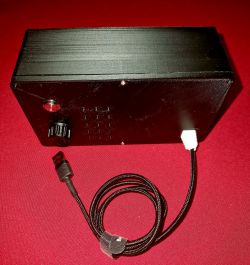
I connected a 5kOhm potentiometer to the I2C converter jumper so that I could 'adjust the brightness' of the display.
Power supply with samsung cable - I cut off the broken USB-C end.
A bend from a broken power supply.
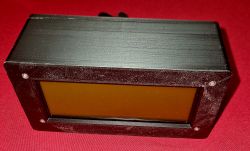
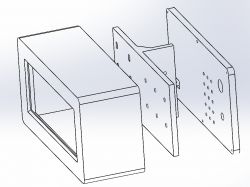
3D printing I made ABS. SolidWorks, STEP, STL files - attached.
Works cool. Recommended.
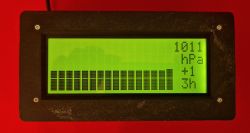
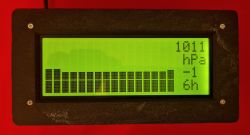
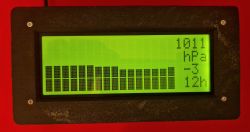
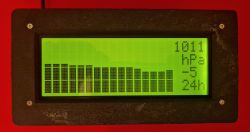
It looks like this:
 .
.
 .
.
 .
.
 .
.
 .
.
 .
.
 .
.
 .
.
 .
.
IF YOU WOULD LIKE, please suggest changing the code as described below.
TO:
- The dream would be that the graph would be scaled for each interval (3, 6, 12, 24h) and start with the minimum measured pressure value as the minimum of the Y axis and end with the maximum measured pressure value and this would be the MAX of the Y axis.
Of course, this is a redesign. Not my design. The author is Mirko Pavleski. I only adapted to the poor-elements.
I bought another one - broken, it's sitting under the kitchen table waiting for a return label.
I bought a third one - a new USSR, but it didn't survive transport....
So much for the basic question "why do this, isn't it easier to buy on the alegro?", or: "they are available online - why waste time?".
I found the projects SECRET and closed on the electrode, so had to look elsewhere. It was supposed to be simple, easy, clear, not very expensive.
I rummaged through my resources. I had a display (about 50pln), a Nano (about 12pln), and for 4pln I bought an I2C SPI BMP280 3.3V pressure transmitter.
I used this development: Link but it proved problematic to use the AdaFruit BME280 product because of the price (over 70pln cheapest I could find).
I have converted the code to the following, as the regular BME280 does not support all the commands as the AdaFruit does:
#include <LiquidCrystal_I2C.h>
#include <Wire.h>
#include "GyverButton.h"
#include <BME280I2C.h>
#define BTN_PIN 3
#define BASE_PERIOD 675000
#define MIN_VAL 990
#define MAX_VAL 1035
LiquidCrystal_I2C lcd(0x27, 20, 4);
GButton butt1(BTN_PIN);
BME280I2C bme;
uint32_t tmr1, tmr2;
uint32_t set_period = BASE_PERIOD;
int16_t plot_array[20];
uint16_t base_array[128];
int16_t value, delta;
byte interval = 1 ;
void setup() {
  read_all();
  attachInterrupt(1, isr, CHANGE);
  butt1.setDebounce(80);
  butt1.setTimeout(300);
  lcd.init();
  lcd.backlight();
  lcd.clear();
  Wire.begin();
  if (!bme.begin()) { // Initialization of the BME280 sensor
    lcd.setCursor(3, 1);
    lcd.print(F("NIE WIDZE CZUJKI"));
    lcd.setCursor(7, 2);
    lcd.print(F("BME280"));
    while (1);
  }
  if (!digitalRead(BTN_PIN)) {
    for (byte i = 0; i < 128; i++) base_array[i] = 0;
    update_all();
    lcd.setCursor(4, 1);
    lcd.print(F("KASUJ HISTORIE"));
    lcd.setCursor(8, 2);
    lcd.print(F("<OK>"));
  }
  while (!digitalRead(BTN_PIN));
  lcd.clear();
  initPlot();
  float pres, temp, hum;
  bme.read(pres, temp, hum);
  value = round(pres);
  base_array[0] = value;
  get_data();
}
void isr() {
  butt1.tick();
}
void loop() {
  butt1.tick();
  if (butt1.isClick()) {
    interval *= 2;
    if (interval > 8) interval = 1;
    set_period = BASE_PERIOD * interval;
    get_data();
  }
  if (millis() - tmr1 >= BASE_PERIOD) {
    tmr1 = millis();
    for (int i = 126; i >= 0; i--) {
      base_array[i + 1] = base_array[i];
    }
    float pres, temp, hum;
    bme.read(pres, temp, hum);
    value=round(pres);
    base_array[0] = value;
    update_all();
  }
  if (millis() - tmr2 >= set_period) {
    tmr2 = millis();
    get_data();
  }
}
void get_data() {
  for (int i = 15; i >= 0; i--) {
    drawPlot(0, 3, 16, 4, MIN_VAL, MAX_VAL, (base_array[i * interval]));
  }
  delta = ((base_array[0]) - (base_array[15 * interval]));
  screen_data(value, delta, (interval * 3));
}
void screen_data(int value, int delta, byte interval) {
  lcd.setCursor(16, 0);
  lcd.print(int(value));
  lcd.setCursor(17, 2);
  if (delta == value) delta = 0;
  if (delta > 0) {
    lcd.print("+");
  } else if (delta < 0) {
    lcd.print("-");
  } else if (delta == 0) {
    lcd.print(" ");
  }
  lcd.setCursor(18, 2);
  lcd.print(abs(delta));
  if (abs(delta) < 10) {
    lcd.setCursor(19, 2);
    lcd.print(" ");
  }
  lcd.setCursor(17, 1);
  lcd.print("hPa");
  lcd.setCursor(17, 3);
  lcd.print(interval);
  (interval < 10) ? lcd.print("h ") : lcd.print("h");
}
void initPlot() {
  byte row8[8] = {0b11111,  0b11111,  0b11111,  0b11111,  0b11111,  0b11111,  0b11111,  0b11111};
  byte row7[8] = {0b00000,  0b11111,  0b11111,  0b11111,  0b11111,  0b11111,  0b11111,  0b11111};
  byte row6[8] = {0b00000,  0b00000,  0b11111,  0b11111,  0b11111,  0b11111,  0b11111,  0b11111};
  byte row5[8] = {0b00000,  0b00000,  0b00000,  0b11111,  0b11111,  0b11111,  0b11111,  0b11111};
  byte row4[8] = {0b00000,  0b00000,  0b00000,  0b00000,  0b11111,  0b11111,  0b11111,  0b11111};
  byte row3[8] = {0b00000,  0b00000,  0b00000,  0b00000,  0b00000,  0b11111,  0b11111,  0b11111};
  byte row2[8] = {0b00000,  0b00000,  0b00000,  0b00000,  0b00000,  0b00000,  0b11111,  0b11111};
  byte row1[8] = {0b00000,  0b00000,  0b00000,  0b00000,  0b00000,  0b00000,  0b00000,  0b11111};
  lcd.createChar(0, row8);
  lcd.createChar(1, row1);
  lcd.createChar(2, row2);
  lcd.createChar(3, row3);
  lcd.createChar(4, row4);
  lcd.createChar(5, row5);
  lcd.createChar(6, row6);
  lcd.createChar(7, row7);
}
void drawPlot(byte pos, byte row, byte width, byte height, int min_val, int max_val, int fill_val) {
  for (byte i = 0; i < width; i++) {
    plot_array[i] = plot_array[i + 1];
  }
  fill_val = constrain(fill_val, min_val, max_val);
  plot_array[width - 1] = fill_val;
  for (byte i = 0; i < width; i++) {
    int infill, fract;
    infill = floor((float)(plot_array[i] - min_val) / (max_val - min_val) * height * 10);
    fract = (infill % 10) * 8 / 10;
    infill = infill / 10;
    for (byte n = 0; n < height; n++) {
      if (n < infill && infill > 0) {
        lcd.setCursor(i, (row - n));
        lcd.write(0);
      }
      if (n >= infill) {
        lcd.setCursor(i, (row - n));
        if (fract > 0) lcd.write(fract);
        else lcd.write(16);
        for (byte k = n + 1; k < height; k++) {
          lcd.setCursor(i, (row - k));
          lcd.write(16);
        }
        break;
      }
    }
  }
}
void update_all() {
  eeprom_update_block((void*)&base_array, 0, sizeof(base_array));
}
void read_all() {
  eeprom_read_block((void*)&base_array, 0, sizeof(base_array));
}
I connected a 5kOhm potentiometer to the I2C converter jumper so that I could 'adjust the brightness' of the display.
Power supply with samsung cable - I cut off the broken USB-C end.
A bend from a broken power supply.
3D printing I made ABS. SolidWorks, STEP, STL files - attached.
Works cool. Recommended.
It looks like this:
 .
.
 .
.
 .
.
 .
.
 .
.
 .
.
 .
.
 .
.
 .
.
IF YOU WOULD LIKE, please suggest changing the code as described below.
TO:
- The dream would be that the graph would be scaled for each interval (3, 6, 12, 24h) and start with the minimum measured pressure value as the minimum of the Y axis and end with the maximum measured pressure value and this would be the MAX of the Y axis.
Of course, this is a redesign. Not my design. The author is Mirko Pavleski. I only adapted to the poor-elements.
Cool? Ranking DIY


