radar1967 wrote: As for the angle of 25 * .... these panels only lie on the roof at this time of the year.
But don't forget that when they lie flat or nearly flat, they work best in diffused light.
The difference to the oblique ones is really big.
Of course, there is nothing like perfectly positioned, or on trackers, but that's not what I wanted.
And I would like to draw your attention to the path of light in December and June, that is, in the shortest and longest days.
Assuming that the atmosphere layer of about 80 km is important from the point of view of obstacles for light,
we have 91 km in June and 286 km in December, of course, for a specific latitude.
These numbers are for my installation located at ~ 52 ° parallel.
The difference is considerable because it is 3.14 times greater. Convergence with the number ? (pi) - random.
Assuming some state of pollution in the atmosphere (e.g. a volcanic eruption somewhere on Earth) the impact is huge.
That is, this path is 3.14 times greater, because then the scattered light is of importance.
I hope this data is shown below with a suitable drawing. (Rg 6371 km = mean radius of the Earth's geoid).
Anyway, I asked for it
prose o January chart (thanks) only for weather-performance comparisons,
without going into details, and what for.
I would also like to show the real influence of diffused light on the results of energy production.
I have a neighbor who has just installed 35 panels on two slopes of an unfavorably located roof.
To the east (97 °) it has 15 pieces, and to the west (277 °) it has 20 pieces. Panels of 345Wp, so in total it has
12,075 Wp .
For me, two thongs of 13 pieces = 26 in total give
8.060 Wp . Both inverters are the same SOFARY 8.8.
The proportion of installed capacity is 1.5 in favor of the neighbor (G18). But in the sun, I have much more,
but in the clouds he (exactly 1.5 times more). The conclusion is that the position of the panels is very important,
but only in good weather conditions. In bad, it doesn't really matter.
I know, maybe it's nothing new, but it's backed up by data.
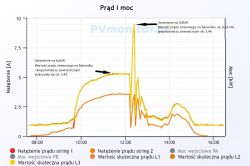
Below is a chart from 2 days in December. One in full sun and the other in overcast.
My installation on the charts is G19, my neighbor - G18.
In June I will make the same chart for the 2 extreme days.
A fruitful analysis.


